The Ultimate Guide to the Three Inside Down Candlestick Pattern
- What is the Three Inside Down Candlestick Pattern?
- Anatomy of the 3 Inside Down Candle Pattern
- Market Psychology: Why It Works
- How to Trade the Three Inside Down Pattern?
- Common Pitfalls to Avoid
- Conclusion
- Frequently Asked Questions
In the high-stakes arena of stock trading in 2026, the difference between a profitable exit and a devastating loss often comes down to timing. While many traders rely on lagging indicators, professional price action traders look for specific “signatures” in the market—patterns that reveal exactly when the bulls have run out of steam.
One of the most potent of these signals is the three inside down candlestick pattern. As a triple-candle formation, it offers a “story” of market psychology, transitioning from extreme optimism to a cold, bearish reality. In this guide, we’ll explore how to identify and trade the 3 inside down candle pattern with the precision of a pro.
What is the Three Inside Down Candlestick Pattern?
The three inside down candlestick pattern is a bearish reversal formation that typically appears at the peak of an uptrend. It is essentially an “upgraded” version of the Bearish Harami. While a Harami consists of only two candles and often requires extra confirmation, the three inside down candlestick pattern includes that confirmation as part of its very structure.
This pattern signals that the buying momentum has not only stalled but has been decisively overtaken by selling pressure. For traders on platforms, spotting this early can be the difference between catching a trend reversal at the top or getting trapped in a “bull trap.”
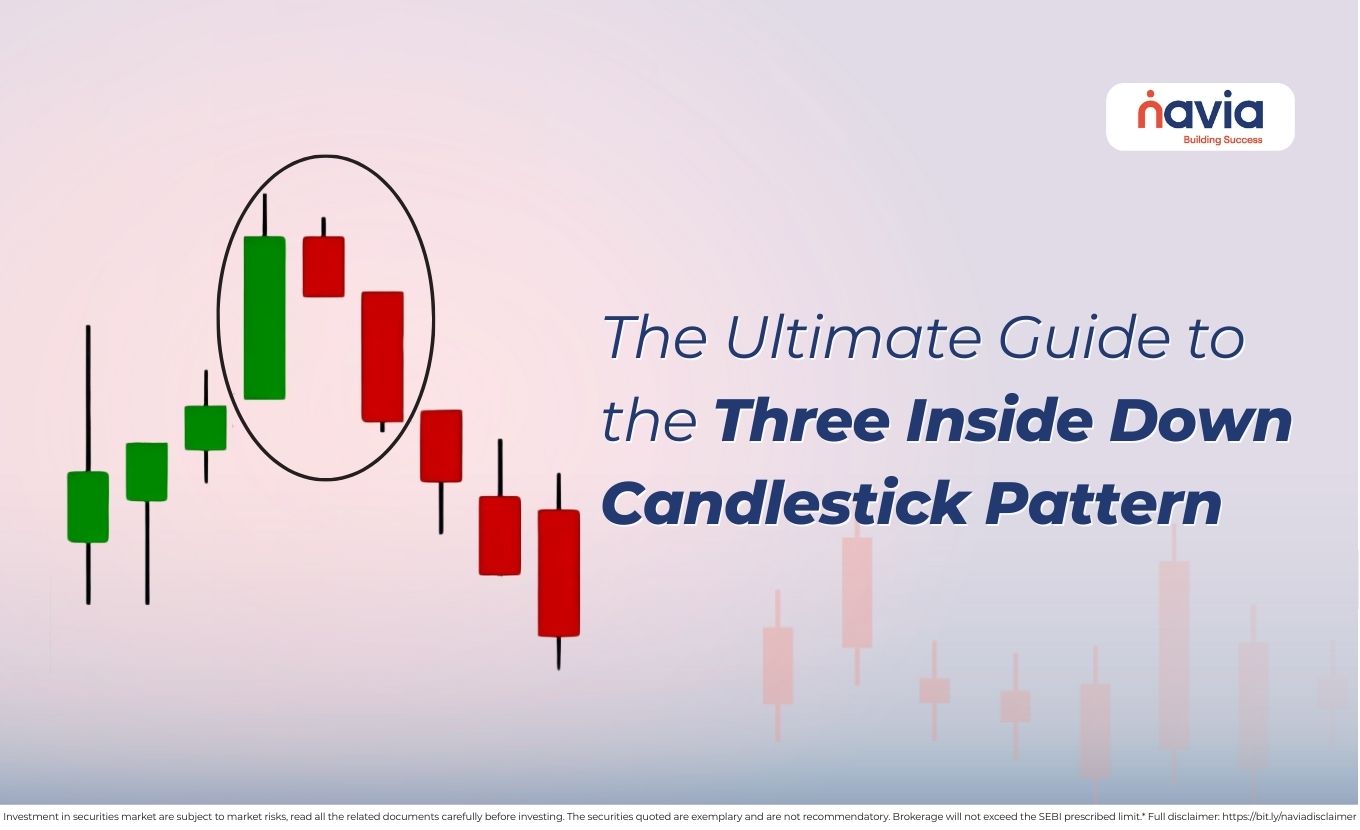
Anatomy of the 3 Inside Down Candle Pattern
To trade this effectively, you must understand the role each of the three candles plays in the narrative.
| The First Candle (The Bullish Peak) | The pattern begins with a large, strong bullish (green/white) candle. This candle represents the climax of the current uptrend. Buyers are in total control, and sentiment is highly optimistic. |
| The Second Candle (The Hesitation) | The second candle is smaller and bearish (red/black). Crucially, its entire body—from open to close—is contained within the body of the first candle. This is known as an “inside bar.” It shows that the bulls tried to push higher but failed, and the bears managed to close the price lower than the previous day’s close. |
| The Third Candle (The Confirmation) | The third candle is a long bearish candle that closes below the low of the first candle. This is the most important part of the 3 inside down candlestick pattern. It proves that the bears have successfully seized control, and the uptrend is officially broken. |
Market Psychology: Why It Works
The effectiveness of the three inside down candlestick pattern lies in the shifting emotions of market participants:
🟠 Day 1: Everyone is buying. The “Fear of Missing Out” (FOMO) is at its peak.
🟠 Day 2: The “Gap Down” or lower open on the second day surprises the bulls. The price stays within the previous day’s range, creating a “wait-and-see” atmosphere. Smart money begins to exit.
🟠 Day 3: Panic sets in. As the price breaks below the first candle low, long-term holders start hitting the sell button to protect profits, and short sellers enter aggressively, creating a self-fulfilling prophecy of falling prices.

How to Trade the Three Inside Down Pattern?
Spotting the pattern is only half the battle; execution is where the profit is made. Here is a professional trading strategy (educational purpose only):
| Confirm the Context | A 3 inside down candlestick pattern is meaningless if it appears in a sideways or choppy market. It must occur after a sustained uptrend or near a known resistance level to be considered a valid reversal signal. |
| Entry Strategy | The safest entry point is at the close of the third candle or on the open of the fourth candle. For aggressive traders, you can enter the moment the third candle breaks below the low of the first candle. |
| Stop-Loss Placement | Your stop-loss should be placed just above the high of the first candle. This is the “line in the sand.” If the price returns to this level, the bearish thesis is invalidated. |
| Take-Profit Targets | Look for the next major support zone or use a 2:1 Reward-to-Risk ratio. Since this is a reversal pattern, the ensuing downtrend can often be quite long, so consider trailing your stop-loss to maximize gains. |
Common Pitfalls to Avoid
🔸 Ignoring Volume: If the third candle of the three inside down candlestick pattern forms at very low volume, it might be a “fakeout.” Look for a surge in volume on the third day to confirm institutional selling.
🔸 Over-Trading: Not every three-candle sequence is a trade. Ensure the first candle is truly “large”, and the second is truly “inside.” If the second candle is too big, the pattern loses its psychological power.
🔸 Neglecting Indicators: Always pair the 3 inside down candle pattern with tools like the Relative Strength Index (RSI). If the RSI is in the “Overbought” zone (above 70) when the pattern forms, the probability of a successful reversal increases significantly.
Conclusion
The three inside down candlestick pattern is one of the most reliable “roadmaps” for short-term and intraday traders. It doesn’t just show you price movement; it shows you a shift in power. By waiting for that third bearish candle to close, you are essentially letting the market prove itself to you before you risk a single rupee.
As markets become more algorithmic in 2026, these classic price action patterns remain the most consistent way to read the “human” side of the market.
Do You Find This Interesting?
We’d Love to Hear from you-

Frequently Asked Questions
What is the three inside down candlestick pattern?
The three inside down candlestick pattern is a bearish reversal formation that appears at the top of an uptrend. It consists of three consecutive bars:
➢ First Candle: A large bullish (green) candle that continues the uptrend.
➢ Second Candle: A small bearish or bullish candle that is completely contained within the body of the first candle (an “inside bar”).
➢ Third Candle: A large bearish (red) candle that closes below the low of the first candle, confirming the reversal.
What does the three inside candle mean?
A “three inside” formation (whether Up or Down) tells a story of trend exhaustion.
◆ The first large candle shows the current trend is at its peak.
◆ The second “inside” candle shows a sudden drop in volatility and indecision; the market is “pausing” because buyers and sellers are reaching an equilibrium.
◆ The third candle shows which side won the battle. In a Three Inside Down, it means the bears have successfully overwhelmed the bulls.
How to trade with inside candles?
Trading inside candles effectively requires a “breakout” strategy. Here is the standard professional approach:
✔ Identify the Mother Bar: The large candle that precedes the inside candle is the “Mother Bar.” Mark its high and low.
✔ Wait for the Breakout: Place a Sell Stop just below the low of the mother bar (for bearish setups) or a Buy Stop just above its high (for bullish setups).
✔ Confirm with the Third Candle: Most successful 2026 traders wait for the third candle to close outside the mother bar’s range to avoid “fakeouts.”
✔ Stop Loss: Place your stop loss on the opposite side of the Mother Bar.
What is the most powerful pattern in trading?
While “most powerful” is subjective, the Engulfing Pattern and the Pin Bar are widely considered the most reliable due to their clear rejection of price levels. However, in terms of statistical accuracy, three-candle patterns like the Three Inside Down or Evening Star are often more powerful because they include a built-in “confirmation” candle, which filters out many false signals.
DISCLAIMER: Investment in securities market are subject to market risks, read all the related documents carefully before investing. The securities quoted are exemplary and are not recommendatory. Full disclaimer: https://bit.ly/naviadisclaimer.