Breaking Through the Gloom: Decoding the Bullish Piercing Line Pattern
- What is the Piercing Line Pattern?
- Anatomy of the Piercing Line Candlestick
- Psychology Behind the Piercing Line Candle Pattern
- Executing the Piercing Line Candlestick Chart
- Conclusion: Riding the Bull with the Piercing Line
- Frequently Asked Questions
In this volatile world of financial markets, charts represent the struggles and triumph between buyers and sellers. Bearish patterns warn, and the bullish signals offer hope to them. After a significant downtrend, every investor looks to make the movement positive for fulfilling their goal. There are several reliable and visually powerful signals available now, one of the famous of them is the piercing line pattern.
This two-candle formation may signal a potential shift from sellers to buyers, and this clear indication shows that the bearish grip is weaking, and a strong bullish reversal is on the cards. To become a disciplined trader, it is necessary to know what is piercing line candlestick pattern is an invaluable skill. This guide will teach you about the structure, psychology, and strategic use of this pattern in detail.
What is the Piercing Line Pattern?
The piercing line pattern is a powerful bullish reversal candlestick pattern. This two-candle formation emerges at the bottom of an established downtrend. It signals that the selling pressure has exhausted itself, and the buyers are stepping aggressively to the market.
The pattern’s name, “piercing line” refers to the second bullish candle “piercing” deep into the real body of the preceding bearish candle. It visually represents the bull’s strong attack against the bears.
Anatomy of the Piercing Line Candlestick
The strength of the piercing line candlestick completely depends on the interaction and relationship of its two components, let’s see what they are:
| The First Candle (The Bearish Dominance) | It’s a long and bearish (red/black) candle that confirms the strength of the existing downtrend. It closes strongly and indicates that the sellers are firmly in control and driving prices lower. |
| The Second Candle (The Bullish Counterattack) | A large and bullish (green/white) candle, that must open below the closing price of the first bearish candle. This bullish candle rallied significantly and closes above the midpoint of the first bearish candle’s real body. This large bullish movement indicates that the buyers have stepped aggressively on the market. |
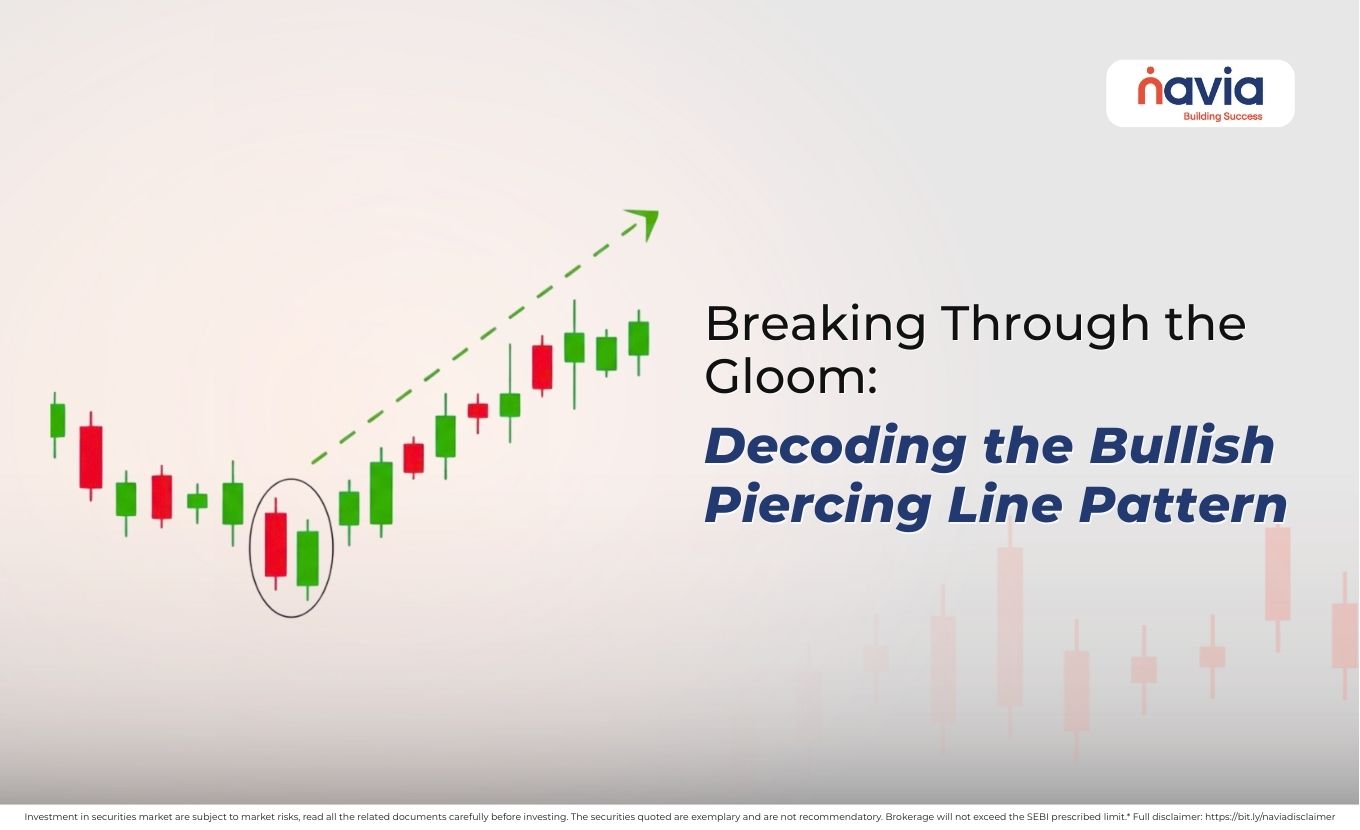
The visual is one of a strong dark candle (Day 1) followed by a seemingly weaker open, but then a powerful light candle (Day 2) that cuts deep into the prior day’s body, showing a dramatic shift.

Psychology Behind the Piercing Line Candle Pattern
The piercing line candle pattern tells you a compelling psychological story of a market transitioning from despair to renewed hope. Let’s see how it works;
Day 1: Despair
In the day 1 the market is dominated by sellers, with a long bearish candle that confirms the downtrend. At that time the investors were pessimistic, and many were selling, expecting further declines.
Day 2: False Hope & Reversal
The second day starts with a gap down; it confirms the bearish trend and deepens despair. Many traders might short at this point, or existing sellers feel validated.
🔹 After the open, aggressive buyers step in with unexpected force. That could be institutional buying, short-covering, or value investors.
🔹 These buyers push the price higher throughout the session, not only recovering the initial gap down but also “piercing” deep into the real body of the first bearish candle. It indicated a significant and unexpected shift in demand.
🔹 The close, above the midpoint of the prior day, shows that the buyers have absorbed the selling pressure and taken decisive control.
This two-day sequence effectively captures the market’s transition from strong bearish sentiment, through a moment of deep despair to a powerful bullish resurgence.
Executing the Piercing Line Candlestick Chart
Identifying the piercing line candlestick chart is a major step, so you must remind yourself to follow confirmation and strict risk management.
| Context and Confirmation | Locate the complete two-candle Piercing Line Pattern at the bottom of a downtrend or a strong support level. The second candle provides initial bullish confirmation, for a high-probability trade, you should wait for the third candle to confirm the new uptrend. |
| Entry and Stop-Loss | Once confirmation is established: Entry: Enter a long (buy) position when the price breaks and closes above the high of the second bullish candle. Stop-Loss: Place your stop-loss order slightly below the low of the second bullish candle. Take Profit: Target the nearest significant resistance level from prior price action or use a trailing stop-loss to manage the trade as the price moves upward. |
Conclusion: Riding the Bull with the Piercing Line
The piercing line pattern is an indispensable tool; its two-step sequences illustrate the market transition from bearish dominance to bullish strength. It also provides high-probability warning of an impending market rally. By diligently seeking out the piercing line pattern at market bottoms, waiting for that essential bullish confirmation and applying disciplined risk management by placing your stop-loss below the low of the second candle, you can strategically enter long positions to capitalize on new uptrends.
Learn to recognize this powerful signal and improve your ability to identify and profit from the volatile turning points of the financial market.
Do You Find This Interesting?
We’d Love to Hear from you-

Frequently Asked Questions
What is a bullish piercing pattern?
A bullish piercing pattern (formally known as the Piercing Line Pattern) is a two-candle bullish reversal pattern that occurs at the bottom of an established downtrend. It signals a potential shift from bearish to bullish momentum.
How to confirm a bullish candle signal?
To confirm the bullish signal generated by the Piercing Line Pattern (or any strong bullish reversal candle), you should look for follow-through confirmation on the subsequent period:
★ Price Action: The candle following the signal pattern should be bullish (green) and should close higher than the high of the signal candle.
★ Volume: Confirmation is stronger if the bullish move is accompanied by higher-than-average trading volume, indicating institutional participation.
★ Context: The pattern should form exactly at a major support level or a key trendline.
Is a bullish pattern good?
Yes, a bullish pattern is generally considered “good” for traders and investors, as it signals a high probability that the price of the asset is about to move higher.
Which candle is best for intraday trading?
There is no single “best” candle for intraday trading, as reliability depends on context and time frame. However, reversal patterns that show a strong shift in momentum are highly valued.
What do I do when a piercing trading pattern occurs?
When a piercing trading pattern occurs, you should adopt a strategic approach:
➤ Verify: Check if the second bullish candle closed above the midpoint of the first candle.
➤ Confirm: Wait for the next candle to close higher than the second candle.
➤ Enter: Place a long (buy) order after confirmation, typically when the price breaks above the high of the second candle.
➤ Manage Risk: Place a stop-loss order slightly below the low of the second bullish candle to protect against a false breakout.
DISCLAIMER: Investment in securities market are subject to market risks, read all the related documents carefully before investing. The securities quoted are exemplary and are not recommendatory. Full disclaimer: https://bit.ly/naviadisclaimer.