What Is Open Interest Analysis & Why It’s a Game-Changer for Options Traders
If you trade options — whether you’re a beginner or advanced — you’ve probably heard the term Open Interest (OI). But what is it really? And how can you use it to make better trading decisions?
Let’s break it down and explore the real-world use cases of OI analysis for option traders.
What is Open Interest (OI)?
Open Interest is the total number of outstanding (not yet closed or exercised) options or futures contracts in the market at a specific strike price and expiry.
🠖 If you buy 1 lot of Nifty 22,000 Call, and someone sells it to you — OI increases by 1.
🠖 If one of you closes the trade later, OI drops by 1.
Unlike volume (which resets daily), OI is cumulative and shows how many contracts are currently “live.”
Read: 5 Simple Tools to Master Option Analysis
OI ≠ Volume
| Metric | Definition | Resets Daily? | Use Case |
| Volume | Number of contracts traded that day | Yes | Intraday action |
| OI | Total live contracts in the market | No | Position build-up or unwinding trends |
Use Cases of OI Analysis for Options Traders
1. Spot Support & Resistance Levels
High OI at a Call strike = Resistance
High OI at a Put strike = Support
Why it Matters:
These are the levels where the most contracts are open — meaning traders expect the price to stay within that range.
Example:
🠖 Nifty 25,500 CE has the highest Call OI → Likely resistance
🠖 Nifty 24,800 PE has highest Put OI → Likely support
2. Trend Confirmation with Price
Use the combo of Price + OI movement to decode market behavior:
| Price | OI | Interpretation |
| Up | Up | Long Buildup |
| Up | Down | Short Covering |
| Down | Up | Short Buildup |
| Down | Down | Long Unwinding |
Helps confirm if a move is genuine or driven by position closing.
3. Identify Market Sentiment
OI tells you whether traders are getting in or out, and whether they’re bullish or bearish.
🠖 Rising Call OI + falling Call price = Call Writing → Bearish bias
🠖 Rising Put OI + falling Put price = Put Writing → Bullish bias
This gives insight into what smart money is doing.
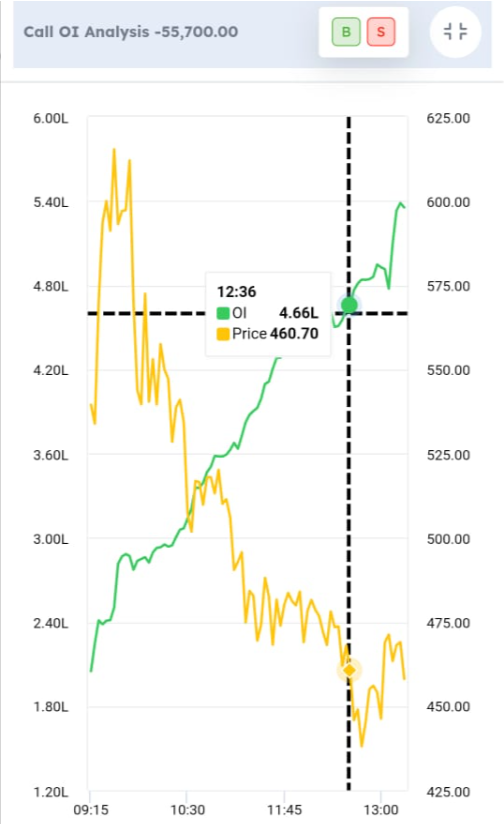
Below is an actual Intra-day Call OI Analysis Chart from Navia All in one Zero Brokerage APP on 19 June 2025 for Bank Nifty which shows Option Price falling with OI rising which Call Writing – > Bearish Bias
4. Expiry Day Trades (Weekly/Monthly)
On expiry day, analyzing OI shifts minute-by-minute can help you:
🠖 Spot likely Max Pain zones
🠖 Gauge whether resistance/support is holding or breaking
🠖 Time your entries and exits better
5. Avoid Traps & False Breakouts
OI analysis helps you stay out of:
🠖 Bull traps (when price spikes but OI shows no new longs)
🠖 Bear traps (when price drops but shorts aren’t building)
Combining OI with price action = confirmation tool
Bonus: What Is “Max Pain”?
Max Pain is the strike price at which option sellers lose the least and buyers lose the most.
Traders use it to estimate where the index/stock may gravitate toward on expiry.
You can track live Max Pain levels using OI data on your broker or data provider platform.
How to Access OI Data?
Most trading platforms provide live OI data, but Navia goes one step further with advanced OI + price analysis tools.
Final Thoughts
OI Analysis isn’t magic — but when combined with:
🠖 Price action
🠖 Volume
🠖 News/Events
…it becomes a powerful tool for options traders.
Use OI to understand the battlefield — where the big players are building, defending, or exiting positions. It can provide additional insights to support decision-making.
Remember: OI is one piece of the puzzle. It doesn’t show who holds the contracts (retail vs institutional) and can sometimes give misleading signals if used in isolation.
Want to access OI Analysis Charts right away?
Download Navia APP now.
Do You Find This Interesting?
We’d Love to Hear from you-

DISCLAIMER: Investments in securities market are subject to market risks, read all the related documents carefully before investing. The securities quoted are exemplary and are not recommendatory. Full disclaimer: https://bit.ly/naviadisclaimer.