Navia Weekly Roundup (Jan 12 – 16 2026)
- Week in the Review
- Indices Analysis
- Interactive Zone!
- Sector Spotlight
- Top Gainers and Losers
- Currency Chronicles
- Commodity Corner
- Top Blogs of the Week!
- N Coins Rewards
Week in the Review
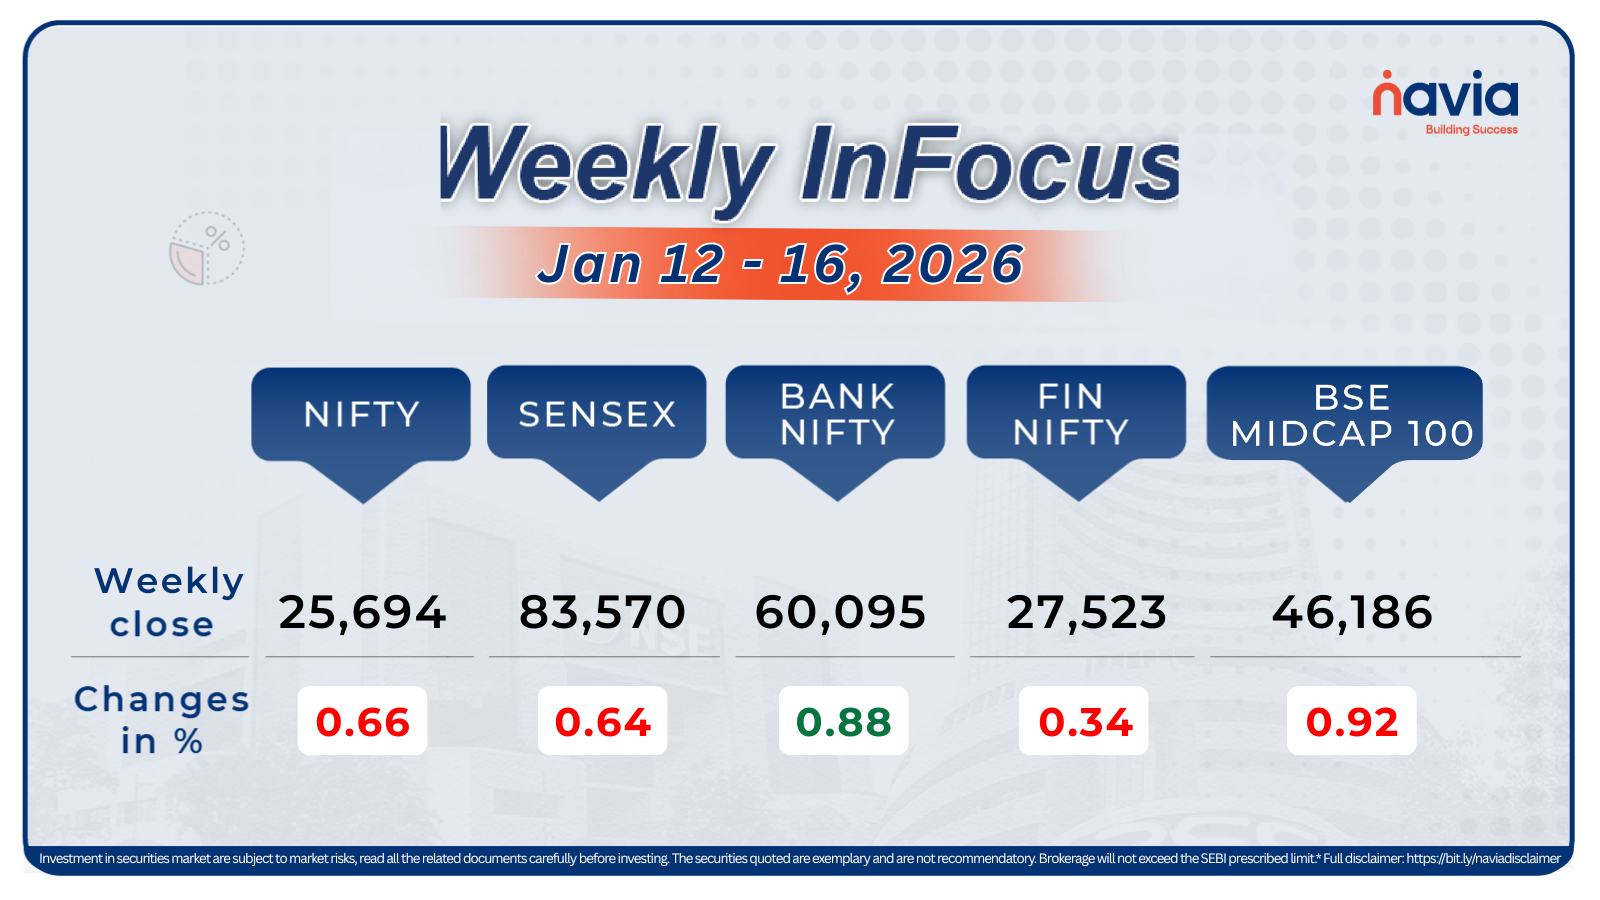
Benchmark indices Sensex and Nifty ended the truncated week largely flat amid elevated volatility, weighed down by global trade uncertainties, geopolitical tensions, mixed global cues, and sustained FII outflows.
Indices Analysis
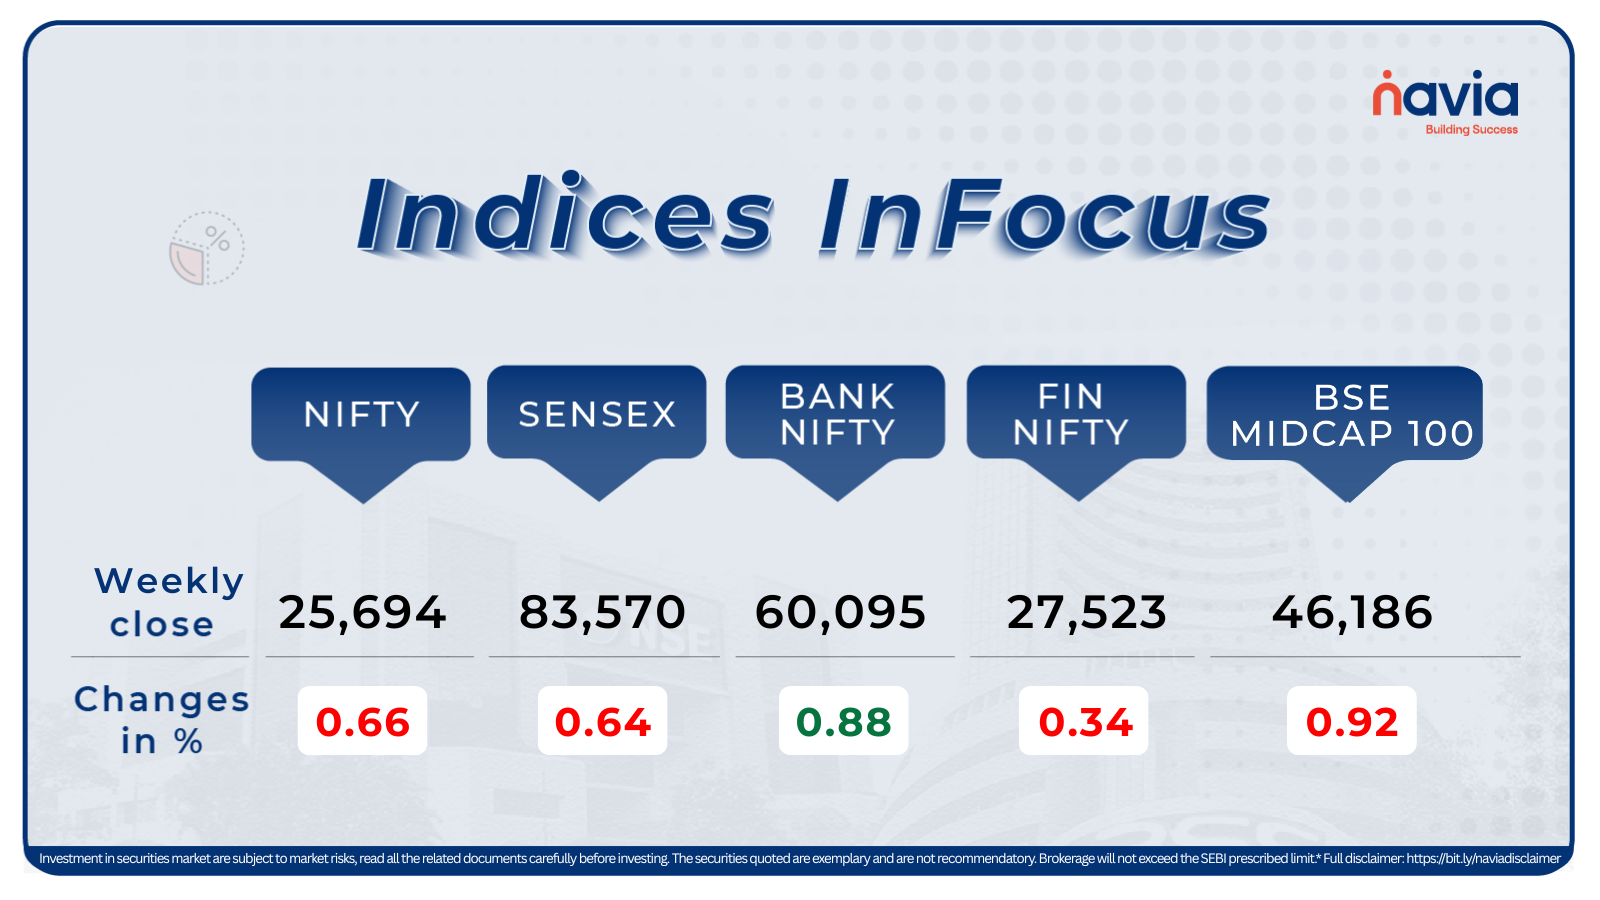
BSE Sensex index fell 0.64 percent at 83,570.35, while Nifty50 index lose 0.66 percent at 25,694.35.
The BSE Mid-cap index ended marginally lower during the week, dragged down by LT Technology Services, Dixon Technologies, GE Vernova TD India, Hitachi Energy India, Bharti Hexacom and Kalyan Jewellers India. Meanwhile, Bank of India, Punjab & Sind Bank, Oil India, Bank of Maharashtra, Federal Bank, Motilal Oswal Financial Services, Dalmia Bharat and Jindal Stainless emerged as gainers.
The BSE Small-cap index declined nearly 0.5 percent during the week. Stocks such as Genesys International Corporation, Nectar Lifesciences, GTPL Hathway, Universal Cables, Tejas Networks, InfoBeans Technologies, Lotus Chocolate Company, United Foodbrands, Amal, Igarashi Motors, Cohance Lifesciences, Globus Spirits and Jindal Poly Films fell between 10–18 percent. Meanwhile, Wardwizard Innovations and Mobility, JTL Industries, Antelopus Selan Energy, IFCI, Baazar Style Retail, Angel One, Dredging Corporation India, 3B BlackBio Dx, Neogen Chemicals and Antony Waste Handling Cell gained between 15–62 percent.
The BSE Large-cap index ended with marginal gains during the week, led by Vedanta, Billionbrains Garage Ventures, Union Bank of India, IndusInd Bank, Punjab National Bank, Tech Mahindra, Oil and Natural Gas Corporation, Tata Steel and Hindustan Zinc. On the other hand, Polycab India, Divi’s Laboratories, CG Power and Industrial Solutions, Adani Energy Solutions, Cipla, ABB India, Larsen & Toubro and Siemens were among the top losers.
Foreign Institutional Investors (FIIs) extended their selling this week, also as they offloaded equities worth Rs 14,265.58 crore. In contrast, Domestic Institutional Investors (DIIs) provided support to the market, purchasing equities worth RS 16,173.69 crore.
Interactive Zone!
Test your knowledge with our Markets Quiz! React to the options and see how your answer stacks up against others. Ready to take a guess?
Sector Spotlight
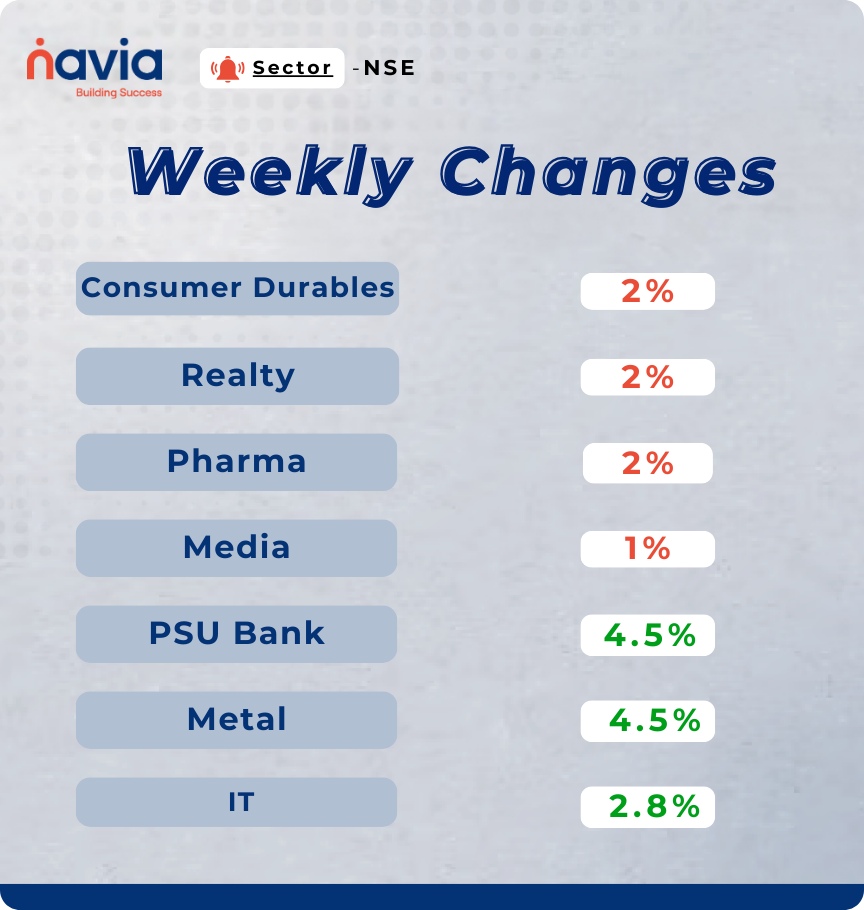
Sectorally, Nifty Consumer Durables, Realty, and Pharma, shed 2 percent each, Nifty Media index was down 1 percent during the week. On the other hand, Nifty PSU Bank and Metal added 4.5% each, and the Nifty IT index rose 2.8%.
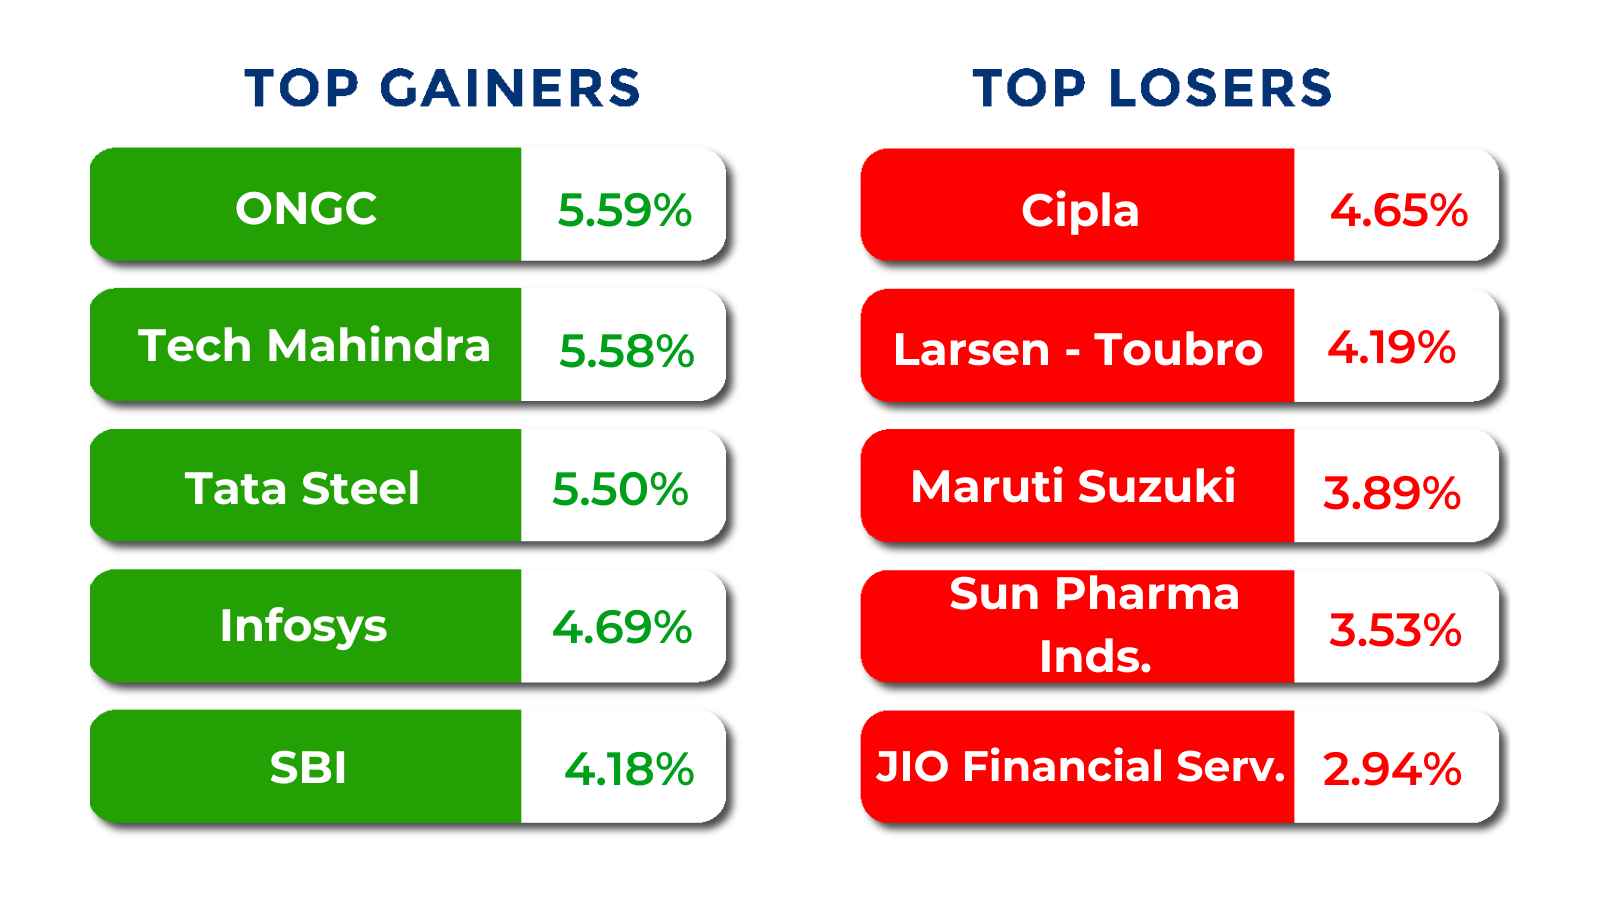
Top Gainers and Losers
Currency Chronicles
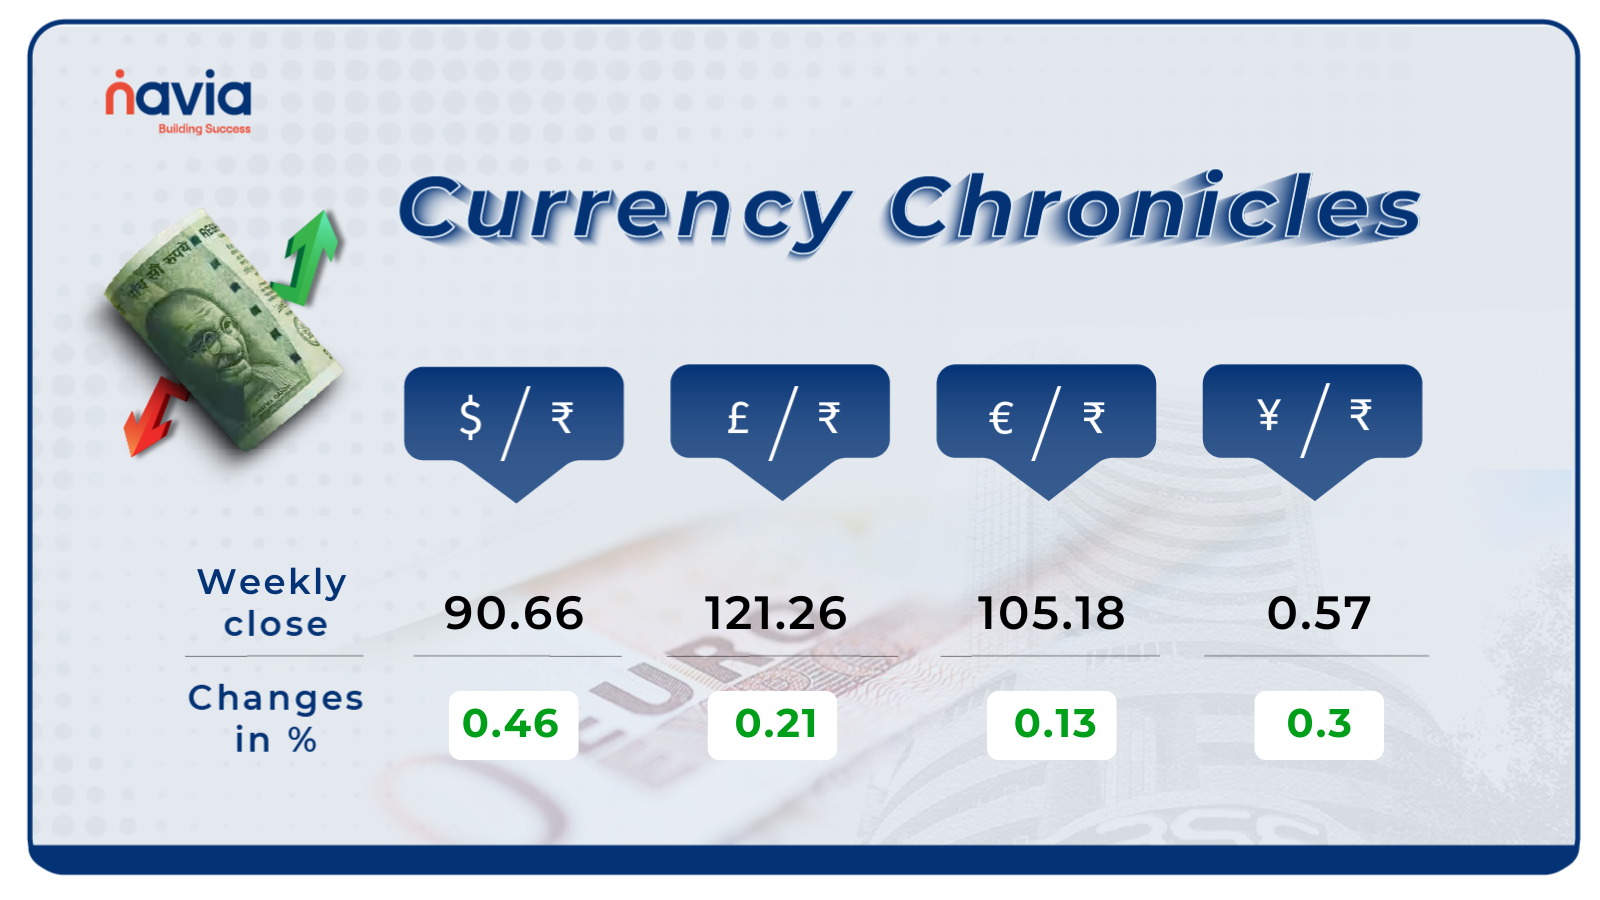
USD/INR:
The USD/INR rate closed at ₹90.66 per dollar, gaining 0.46% during the week, reflecting a bullish market sentiment.
EUR/INR:
The EUR/INR rate closed at ₹105.18 per euro, gaining 0.13% during the week, reflecting a bullish market sentiment.
JPY/INR:
The JPY/INR rate closed at ₹0.57 per yen, gaining 0.3% during the week, reflecting a bullish market sentiment.
Stay tuned for more currency insights next week!
Commodity Corner
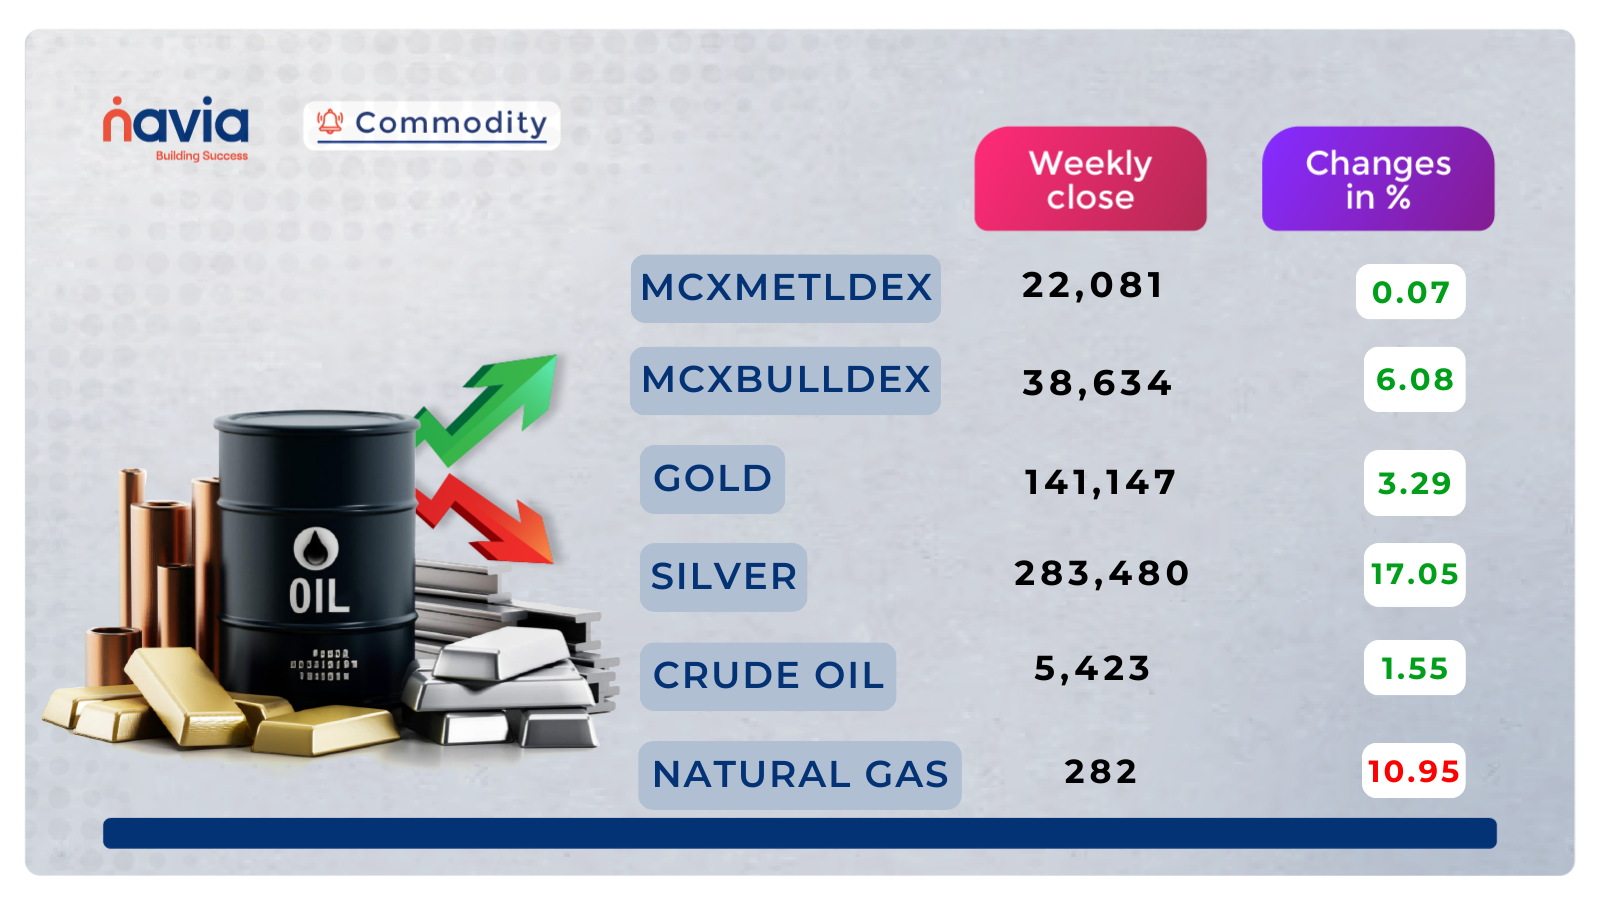
Crude Oil Futures have witnessed a sharp impulsive recovery from the 5,010 demand zone, breaking out of the prior falling channel and shifting the short-term structure to bullish. Price has rallied aggressively and is now trading above the key 5,300–5,330 pivot zone, indicating strong buying interest and short covering. The breakout leg has carried prices close to the 5,430 resistance, which previously acted as a major supply area and breakdown level. While momentum remains positive, the near-vertical move suggests the possibility of a short-term consolidation or pullback before any sustained continuation. As long as Crude Oil holds above 5,300 on a closing basis, the bullish bias remains intact, and dips are likely to attract buyers. A decisive breakout above 5,430 would confirm trend continuation and open the door for a move toward higher resistance zones. However, failure to sustain above 5,300 would signal exhaustion of the current rally and could lead to a retracement toward the lower support band near 5,120–5,010. Overall, the structure has shifted to bullish, but follow-through above resistance is required for continuation.
Gold continues to trade in a strong bullish structure, maintaining a higher high–higher low formation within an upward-sloping channel. Price has successfully broken and sustained above the 140,000 supply zone, which earlier acted as a major resistance and has now turned into a strong demand base. The ongoing consolidation near 143,000–143,300 indicates healthy pause after breakout, not distribution. As long as Gold holds above 140,000, the broader trend remains positively biased. Any dip toward the lower channel support or the 140,000–140,500 zone is likely to attract fresh buying interest. A decisive breakout above 143,500 can accelerate momentum toward 145,000 and higher. Overall structure remains bullish with buy-on-dips preference.
Natural Gas Futures continue to trade under a strong bearish structure, remaining inside a well-defined falling channel. Despite minor intraday bounces, price action clearly reflects seller dominance with consistent lower highs and lower lows. The recent recovery attempt has stalled near the 300–305 zone, which aligns with prior breakdown support and now acts as immediate resistance. Failure to sustain above 313 confirms that the bounce is corrective rather than a trend reversal. As long as prices remain below the 320–325 supply zone, downside risk stays elevated. A decisive break below the 280–285 support band would reinforce bearish momentum and could accelerate the decline toward deeper demand zones near 255. Overall, the broader trend remains bearish, and rallies are likely to be used as selling opportunities until price reclaims key resistance levels.
Do you have a question? Ask here and we’ll publish the information in the coming weeks.
Top Blogs of the Week!
Demat Account Charges Explained: A Comprehensive Guide to Hidden and Visible Costs
A demat account is essentially a digital home for your stocks and bonds. While it makes managing your portfolio much easier, it’s important to understand the routine service charges involved in its upkeep.

Peak Reversal: Mastering the Tweezer Top Candlestick Pattern
A Tweezer Top occurs when two back-to-back candles share nearly identical highs. This pattern indicates a strong price ceiling, often suggesting that the current uptrend is losing steam and may soon reverse.
N Coins Rewards

Refer your Friends & Family and GET 500 N Coins.
Do You Find This Interesting?

DISCLAIMER: Investment in securities market are subject to market risks, read all the related documents carefully before investing. The securities quoted are exemplary and are not recommendatory. Full disclaimer: https://bit.ly/naviadisclaimer.