Navia Weekly Roundup (Feb 23 – 27, 2026)
- Week in the Review
- Indices Analysis
- Interactive Zone!
- Sector Spotlight
- Top Gainers and Losers
- Currency Chronicles
- Commodity Corner
- Top Blogs of the Week!
- N Coins Rewards
Week in the Review
The Indian benchmark indices ended lower for the week on sustained FII outflows, escalating geopolitical risks from inconclusive US-Iran nuclear talks, and broad-based profit booking.
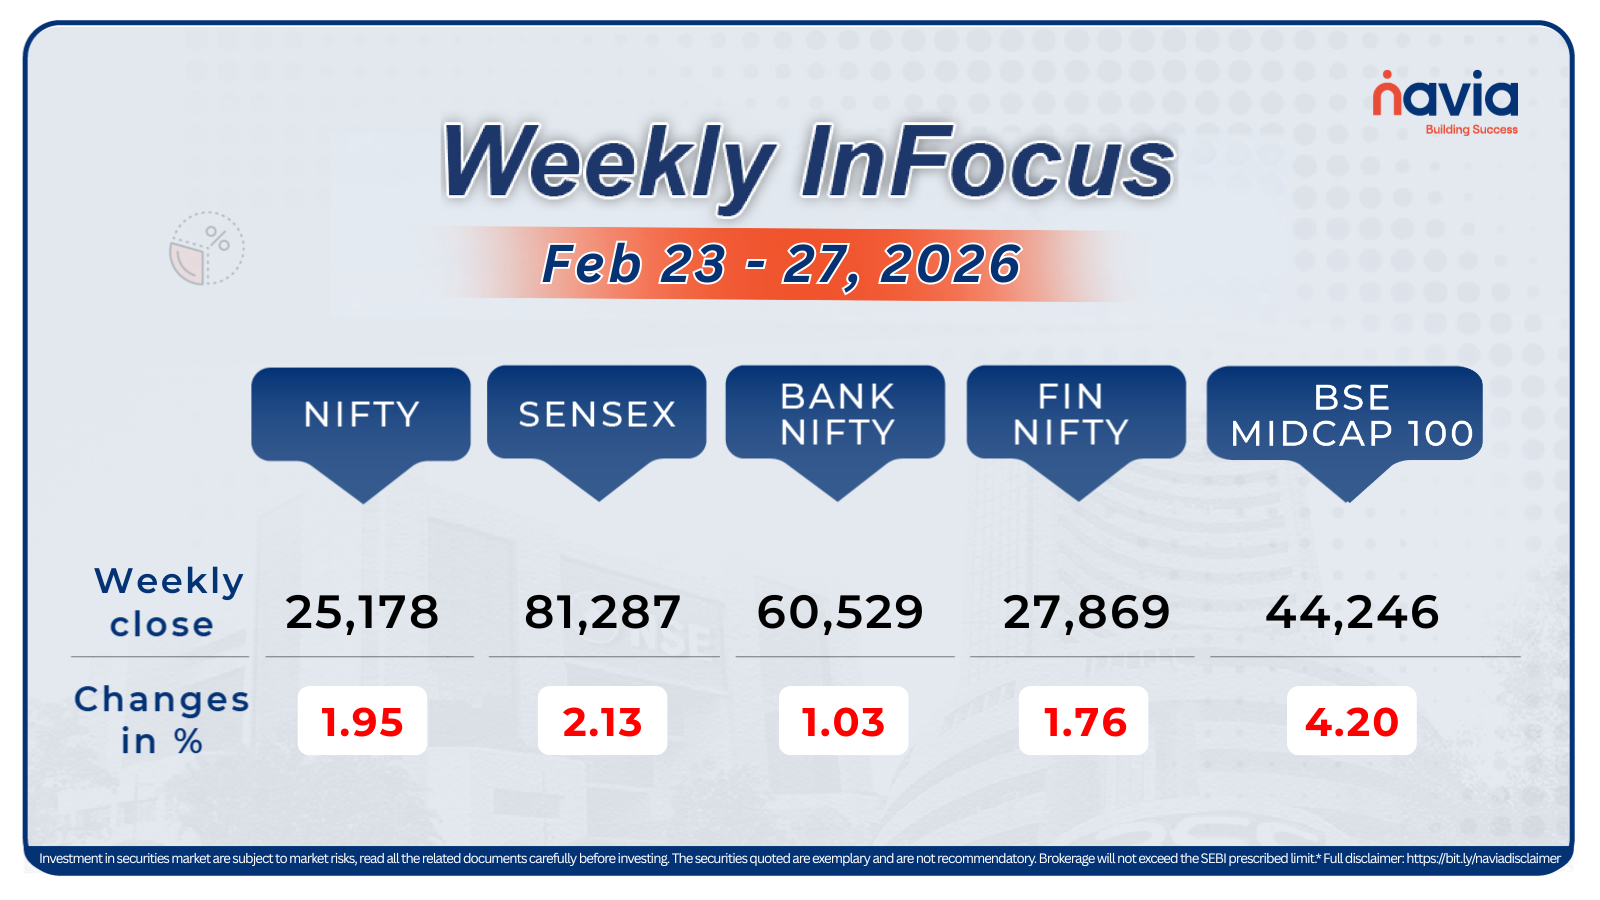
Indices Analysis
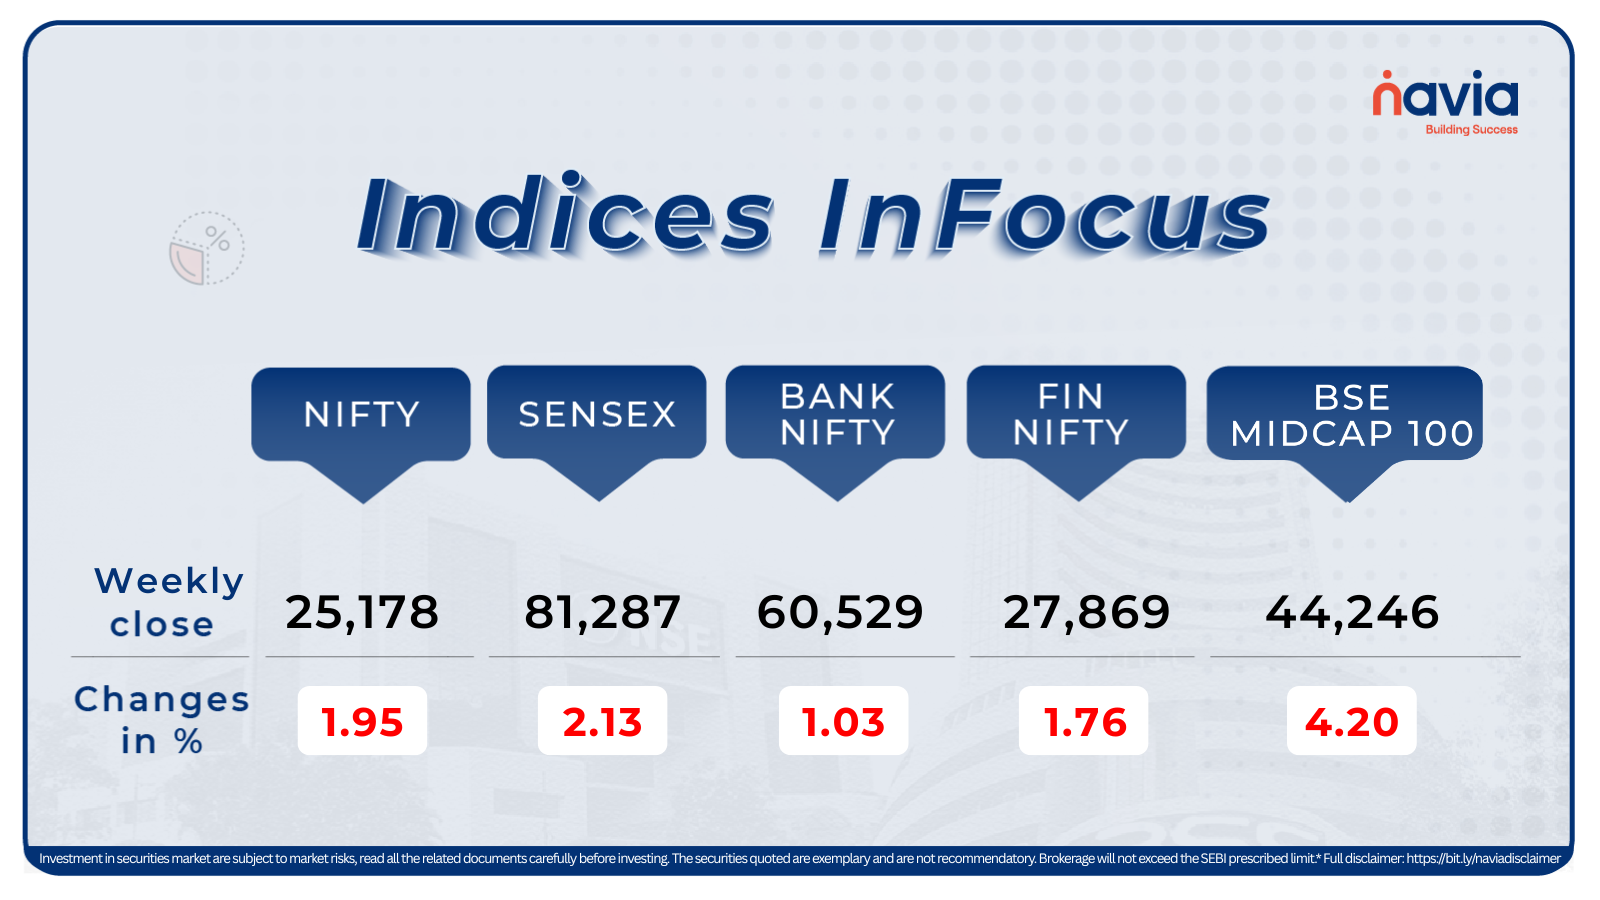
In this week, the BSE Sensex shed 2.13 percent, to finish at 81,287.19, while the Nifty50 lost 1.95 percent, to close at 25,178.65.
The BSE Large-cap Index shed nearly 1.2 percent dragged by Maruti Suzuki, Bharti Airtel, Mahindra & Mahindra, ICICI Bank, Hindustan Unilever, Larsen & Toubro, while Infosys, Reliance Industries, and HDFC Bank gained modestly between 0.5-1 percent.
BSE Mid-cap Index declined 1.0 percent dragged by L&T Finance Holdings, Bandhan Bank, BSE Ltd., Vishal Mega Mart, amid broad profit booking in financials and autos. However, select IT and pharma midcaps like Persistent Systems and Divi’s Laboratories gained between 2-4 percent.
The BSE Small-cap index fell 1.4 percent with heavyweights like Adani Power, Ambuja Cements, AU Small Finance Bank shedding between 2-8 percent on FII selling and risk aversion. On the other hand, niche IT and healthcare smallcaps added between 3-6 percent, providing limited support.
Interactive Zone!
Test your knowledge with our Markets Quiz! React to the options and see how your answer stacks up against others. Ready to take a guess?
Sector Spotlight
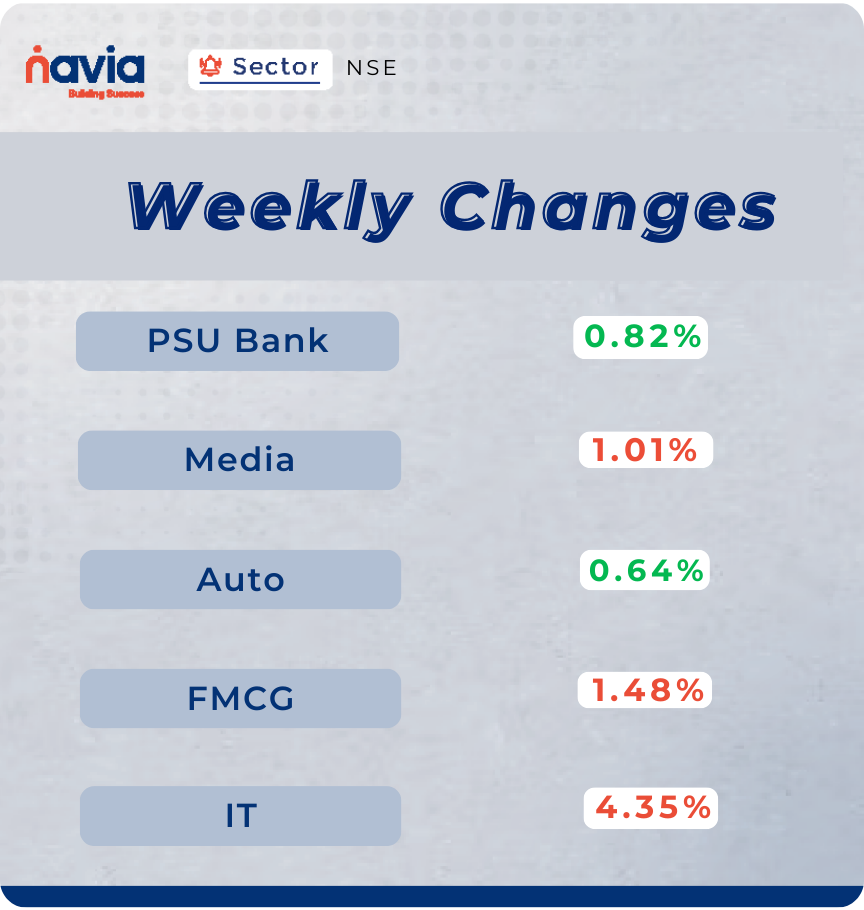
Sectorally, the Nifty PSU Bank index rose 0.82 percent, while the Nifty Auto index gained 0.64 percent. However, the Nifty Media declined 1.01 percent, Nifty FMCG shed 1.48 percent and Nifty IT lost 4.35 percent during the period.
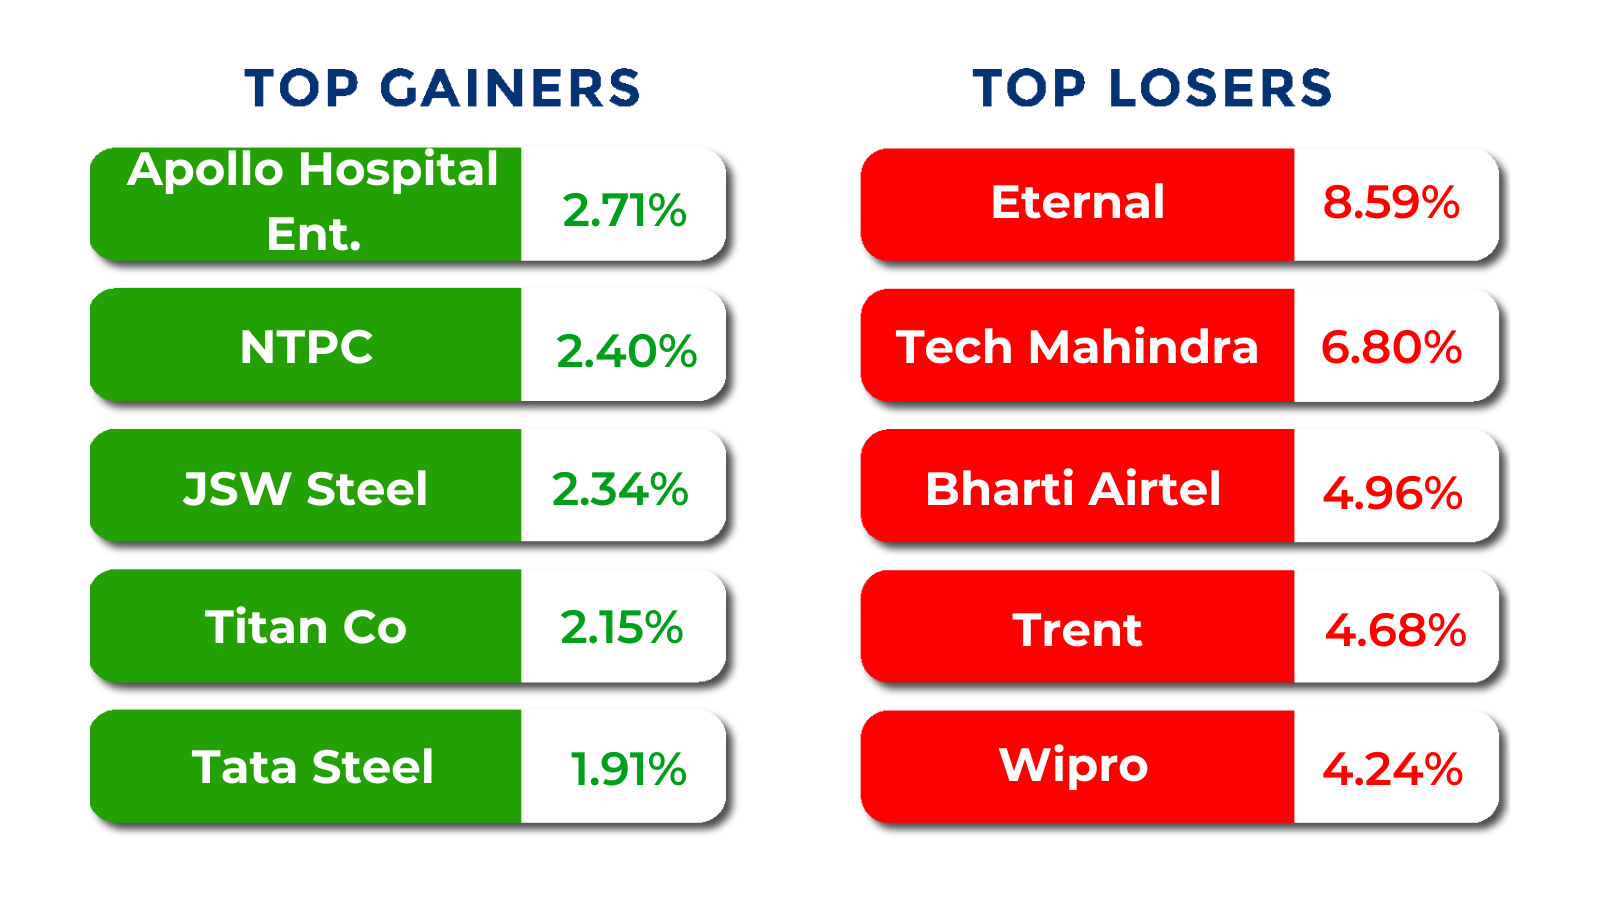
Top Gainers and Losers
Currency Chronicles
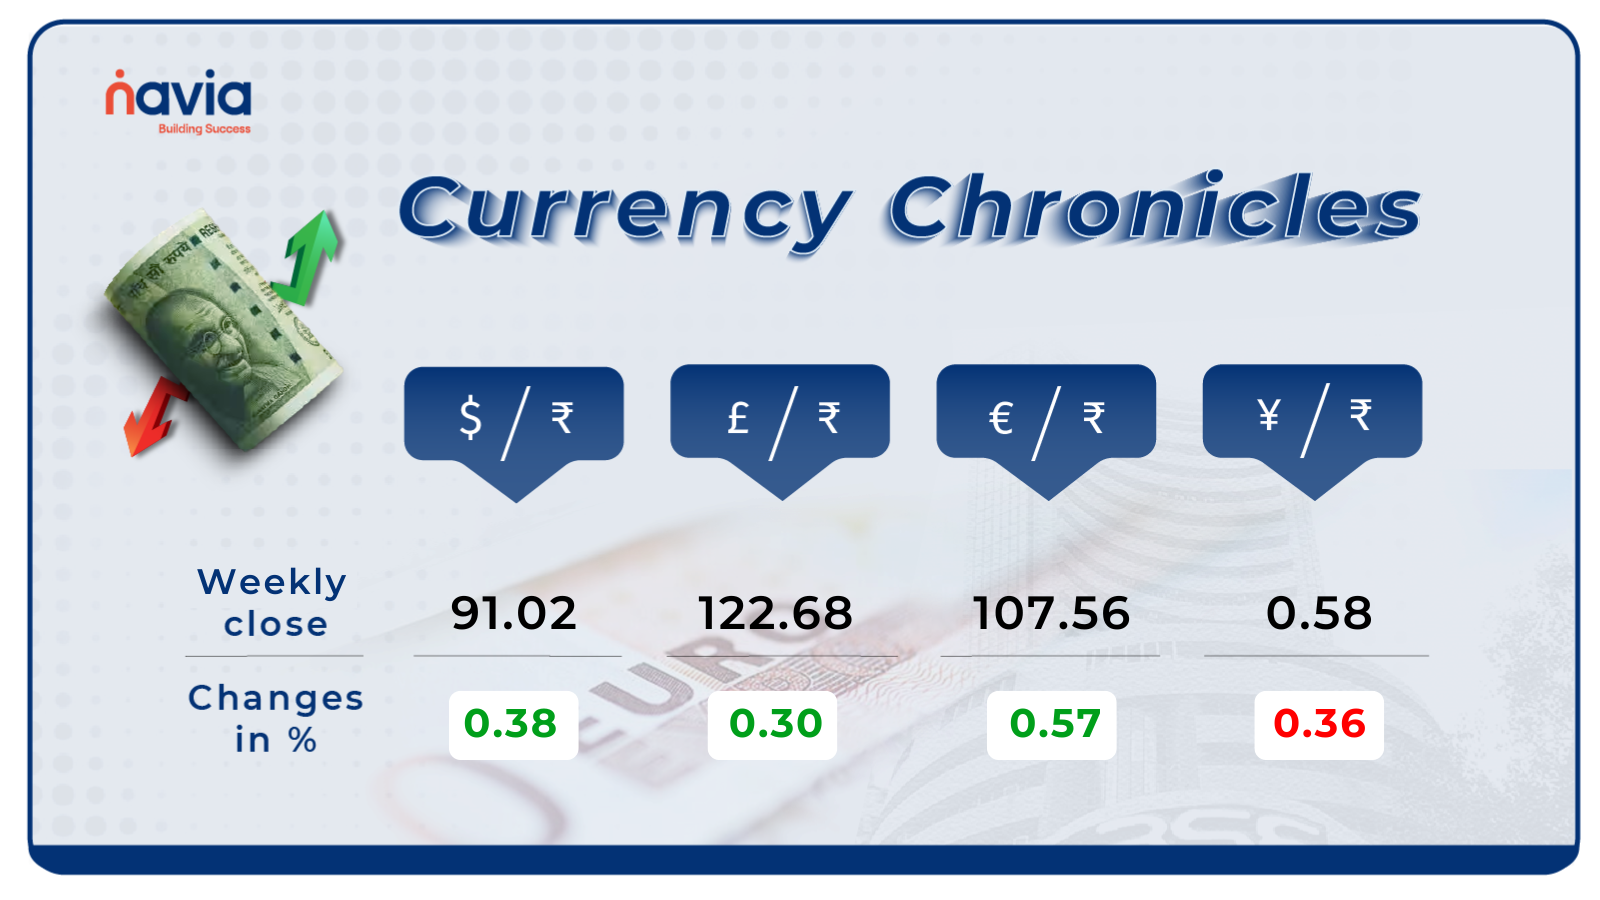
USD/INR:
The USD/INR rate closed at ₹91.02 per dollar, gaining 0.38% during the week, reflecting a bullish market sentiment.
EUR/INR:
The EUR/INR rate closed at ₹107.56 per euro, gaining 0.57% during the week, reflecting a bullish market sentiment.
JPY/INR:
The JPY/INR rate closed at ₹0.58 per yen, losing 0.36% during the week, reflecting a bearish market sentiment.
Stay tuned for more currency insights next week!
Commodity Corner
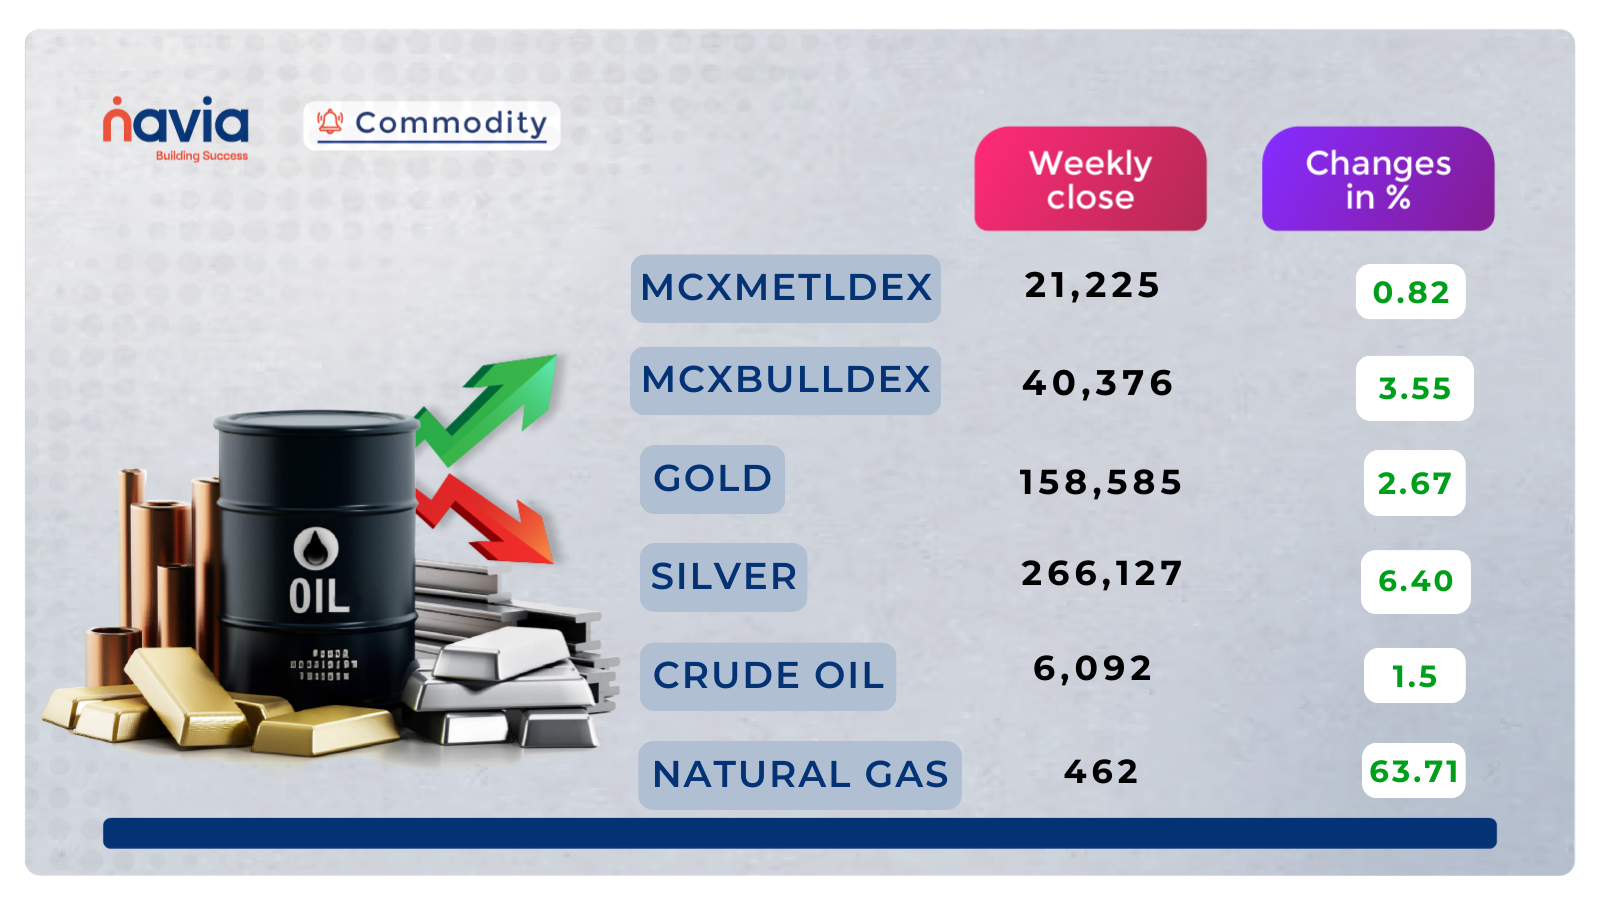
Crude Oil futures last session close at 6092, consolidating just below the key resistance zone at 6106–6138. The price structure remains bullish on the higher timeframe, supported by an ascending trendline from the 5037 base, with a pattern of higher lows and sustained buying interest visible across recent sessions. However, the price continues to face repeated rejections at the 6106–6138 supply area, with the latest candles showing hesitation, smaller bodies, and minor pullback pressure near the upper band. A decisive breakout and sustained close above 6138 could confirm fresh bullish momentum and target 6250–6300 or higher. On the downside, immediate support lies near 5900–5950, followed by strong structural support along the ascending trendline and 5611 zone. A breakdown below 5900 may trigger short-term profit booking or corrective pullback toward 5750–5611 levels.
Gold futures last session close at 158,585, showing mild consolidation with a positive close after pulling back slightly from the recent highs near 1,60,950–1,62,010. Price continues to form higher lows from the strong demand base around 1,49,817–1,51,195, maintaining a short-term bullish structure supported by the ascending price action off the February lows. However, the 1,60,000–1,62,010 area has acted as a consistent supply barrier, with multiple rejections and hesitation visible in recent candles. A decisive breakout and sustained close above 1,62,010 could confirm renewed bullish momentum and open the path toward 1,66,400 and further to 1,74,000–1,76,000 levels. On the downside, immediate support lies near 1,58,000–1,56,000, followed by the stronger structural support at 1,51,195–1,49,817. A breakdown below 1,56,000 may trigger short-term corrective pressure toward 1,49,817–1,45,000 levels.
Natural Gas futures last session close at 462, holding steady just above the major demand zone around 257.9–244.4 after a multi-week downtrend from the sharp peak near 640–600 levels. The price has formed a series of lower highs and lower lows since late January, with the descending trendline from February highs continuing to cap upside attempts. Recent candles show reduced volatility and small bodies near the bottom of the channel, indicating potential exhaustion in selling pressure. The structure remains bearish overall, but the price is now testing a critical support cluster at 257.9–244.4, where previous lows have clustered and held temporarily. A decisive breakdown and sustained close below 244.4 could accelerate downside toward 220–200 levels. On the upside, immediate resistance lies near 280, followed by stronger supply at 300–320 and the descending trendline. A sustained breakout and close above 280 would signal short-term reversal potential and relief rally toward 320–340 or higher.
Silver futures last session close at 266,127 consolidating in the upper part of the recent range after a steady recovery from the February lows. Price has built a clear higher low structure off the major demand base near 231063, with the current zone around 256000–261000 acting as short-term support during the pullback. The broader structure remains range-bound between the strong demand at 231000–235000 and the key supply/resistance zone around 280000–290000. Momentum has picked up modestly with the latest green candle, but repeated failures to sustain above 280000 keep the outlook cautious until a clear breakout occurs. A decisive breakout and sustained move above 290000 could trigger fresh bullish momentum toward 305000 and further to 333000–333255 levels. On the downside, immediate support lies at 256000–250000, followed by the major demand zone at 231063–235000. A breakdown below 250000 may invite renewed selling pressure toward 245000–231000.
Do you have a question? Ask here and we’ll publish the information in the coming weeks.
Top Blogs of the Week!

Understanding the Impact of Zero Brokerage on Your Trading Performance
As trading activity continues to accelerate in 2026, transaction costs remain an important factor in overall portfolio performance. For many retail investors, frequent brokerage charges can gradually impact net returns.

Navigating the Unthinkable: A Guide to Black Swan Events in the Stock Market
In the financial world of 2026, where AI-driven trading and instant global connectivity are the norms, the concept of the Black Swan has moved from a theory in a textbook to a daily reality.
N Coins Rewards

Refer your Friends & Family and GET 500 N Coins.
Do You Find This Interesting?

DISCLAIMER: Investment in securities market are subject to market risks, read all the related documents carefully before investing. The securities quoted are exemplary and are not recommendatory. Full disclaimer: https://bit.ly/naviadisclaimer.