Navia Weekly Roundup (Dec 22 – 26 2025)
- Week in the Review
- Indices Analysis
- Interactive Zone!
- Sector Spotlight
- Top Gainers and Losers
- Currency Chronicles
- Commodity Corner
- Top Blogs of the Week!
- N Coins Rewards
Week in the Review
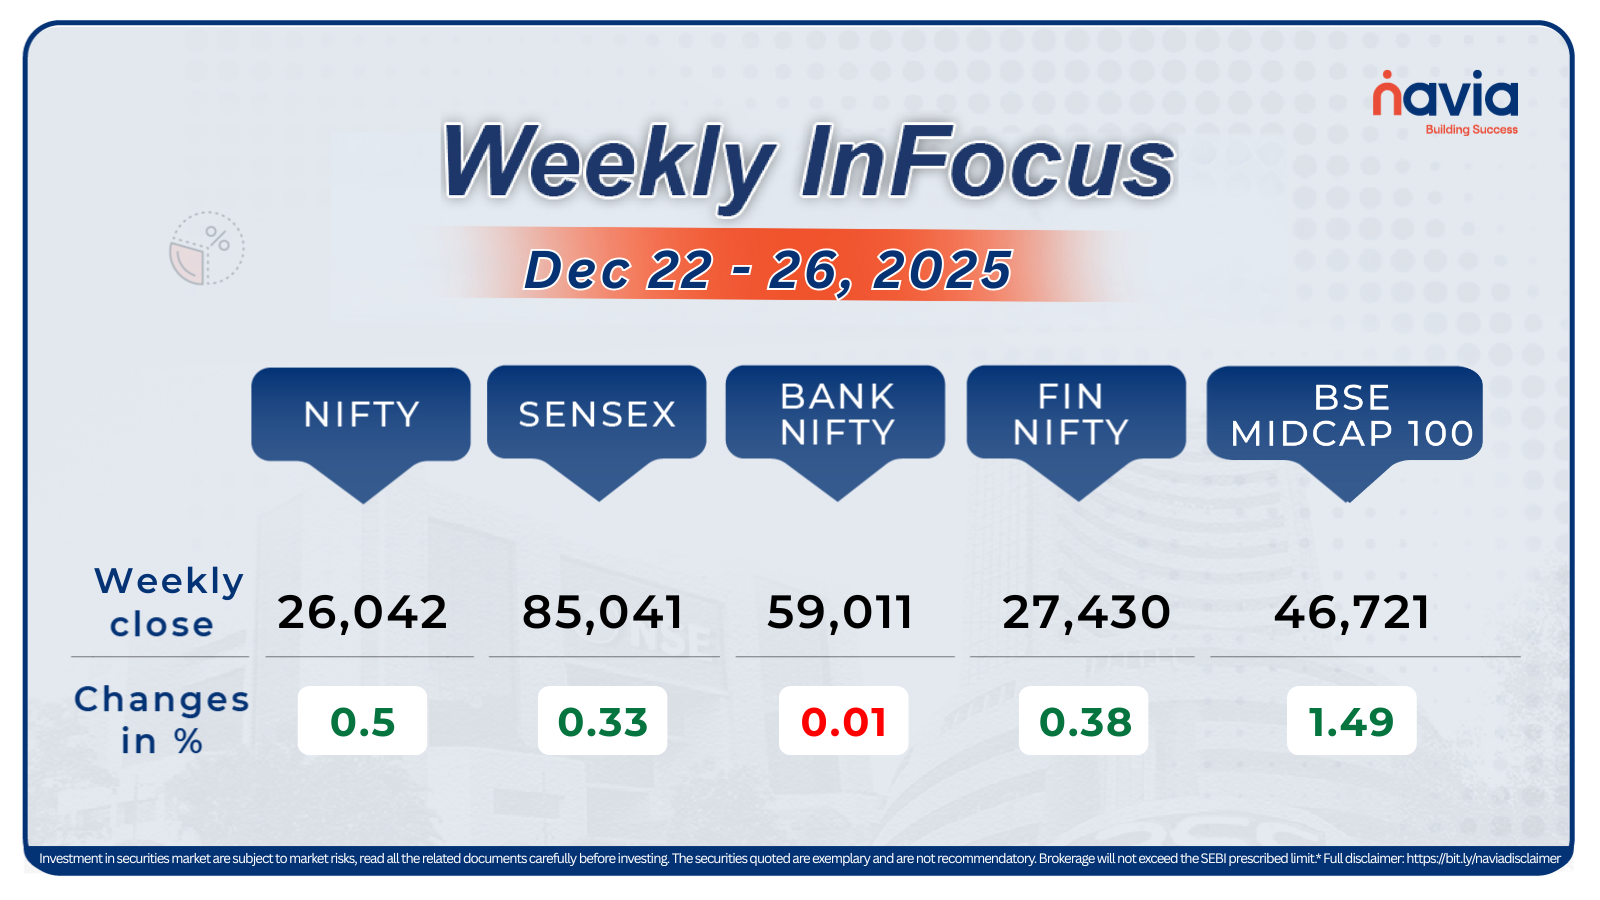
The Indian equity markets did trade with a holiday mood in the final truncated week of 2025 (December 22-26), but ultimately closed lower amid sustained FII selling, a weakening rupee, and uncertainty over the India-US trade deal. Domestic institutional investor (DII) buying helped to cushion the decline.
Indices Analysis
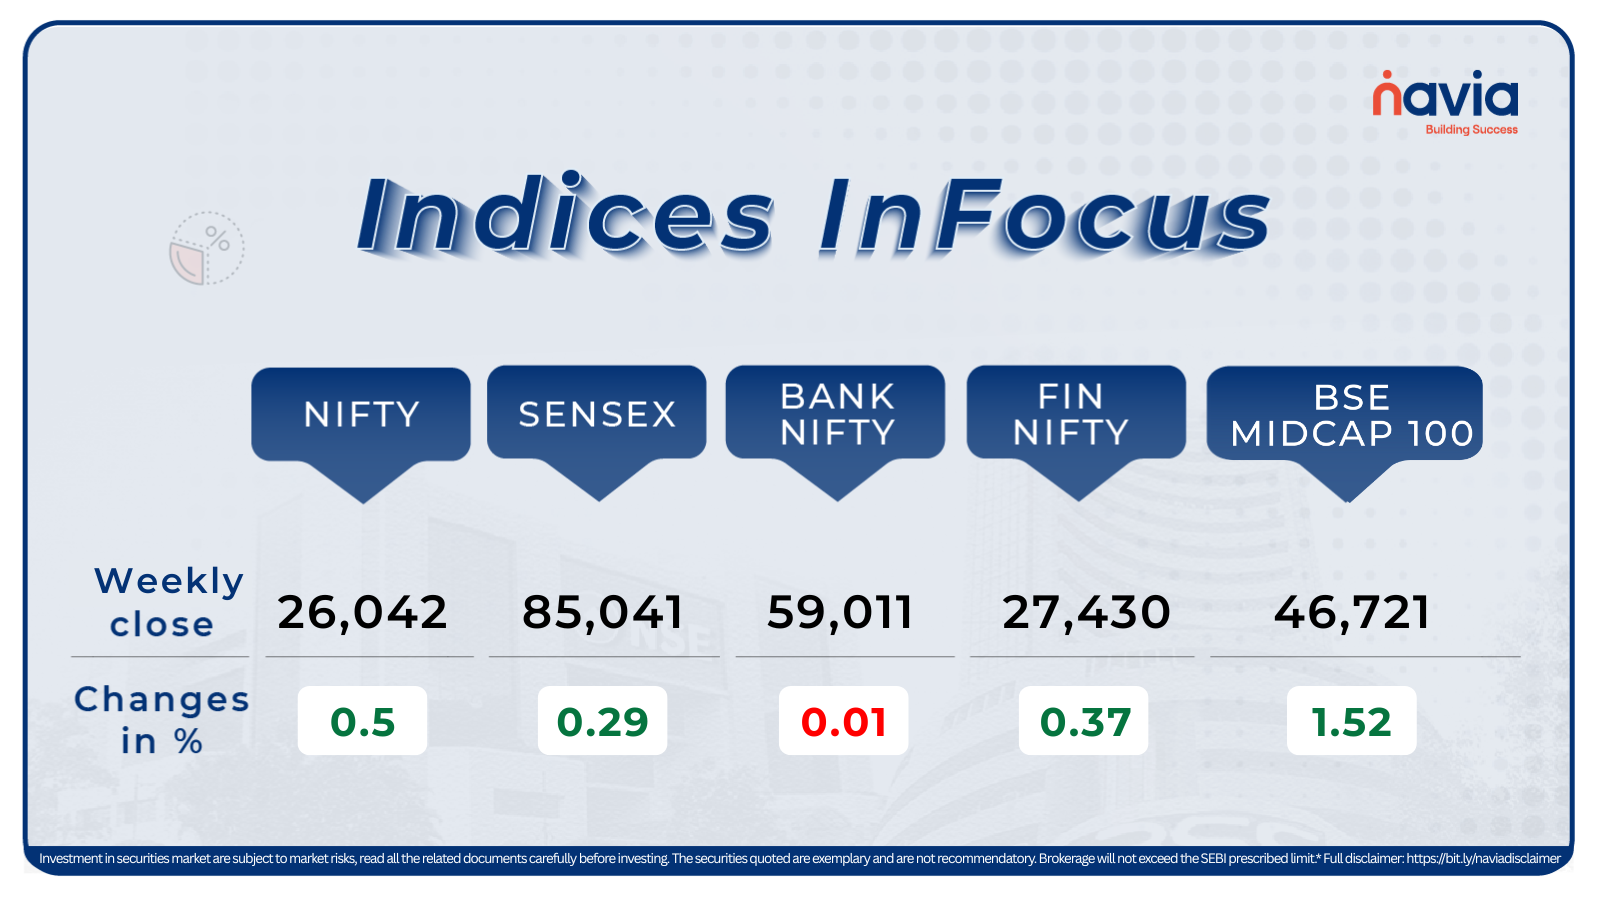
BSE Sensex index added 0.29 percent at 85,041.45, while Nifty50 index rose 0.5 percent at 26,042.30.
The BSE Large-cap Index gained 0.3 percent with Indian Railway Finance Corporation rising more than 17 percent, while Hindustan Zinc, Shriram Finance, Mazagon Dock Shipbuilders, Trent, REC added between 5-8 percent. On the other hand, losers were Swiggy, Siemens Energy India, LG Electronics India, LTIMindtree, Hero MotoCorp, HDFC Life Insurance Company, Union Bank of India, CG Power and Industrial Solutions.
BSE Mid-cap Index rose 0.4 percent with Rail Vikas Nigam rose 21.5 percent, National Aluminium Company gained 10 percent, while NMDC, Bharat Dynamics, Dalmia Bharat, Cochin Shipyard, Kansai Nerolac Paints, Gillette India rose 6-8 percent. However, Coforge, Dixon Technologies, Aegis Vopak Terminals, Hexaware Technologies, Endurance Technologies shed between 5-9 percent.
The BSE Small-cap index added 1 percent with KR Rail Enginerring, Jupiter Wagons, Sasken Technologies, Hindustan Copper, KNR Constructions, Steel Exchange India, Ceinsys Tech, Kothari Industrial Corporation, Deccan Gold Mines rising 21-34 percent, while Lloyds Enterprises, Shoppers Stop, Ecos India Mobility & Hospitality, Embassy Developments, Indo Thai Securities, Epigral, Cigniti Technologies.
Foreign Institutional Investors (FIIs) continued their selling trend in the Indian equity markets during the truncated final week of 2025, offloading equities worth RS 4,290.96 crore. In contrast, Domestic Institutional Investors (DIIs) provided crucial support by remaining net buyers, purchasing equities worth Rs 12,024.49 crore.
Interactive Zone!
Test your knowledge with our Markets Quiz! React to the options and see how your answer stacks up against others. Ready to take a guess?
Sector Spotlight
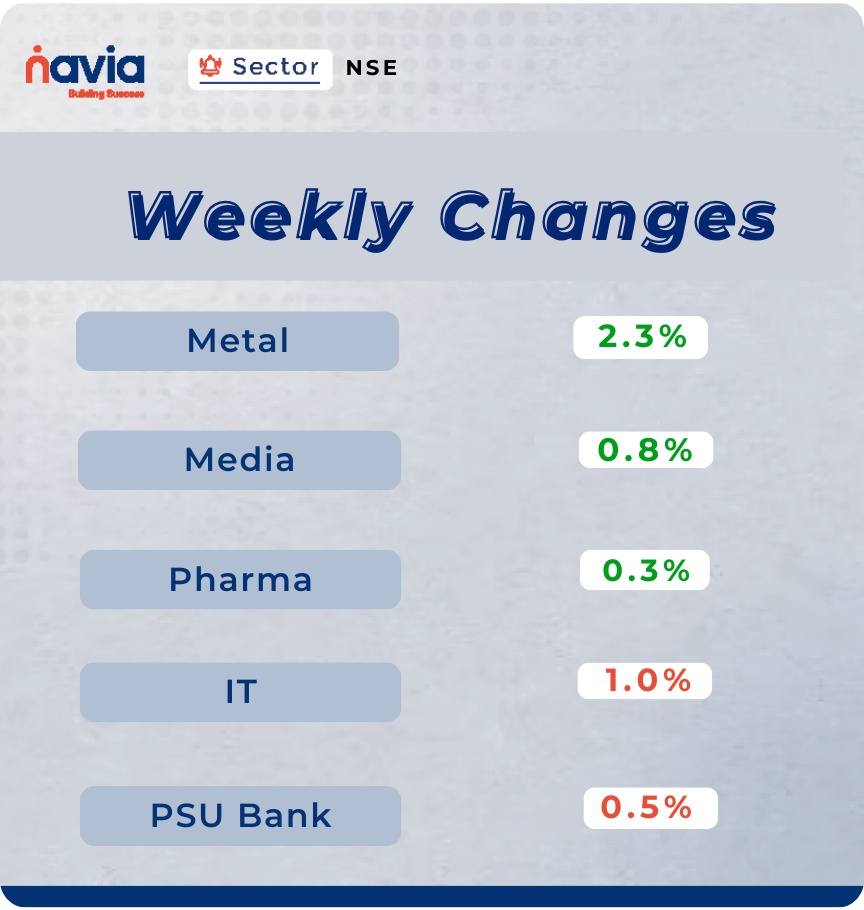
Among sectors, Nifty Metal index up 2.3 percent, Nifty Media gained near 1 percent, and Nifty Pharma gained 0.3%, however, Nifty IT shed 1.0 percent and Nifty PSU Bank down 0.5 percent.
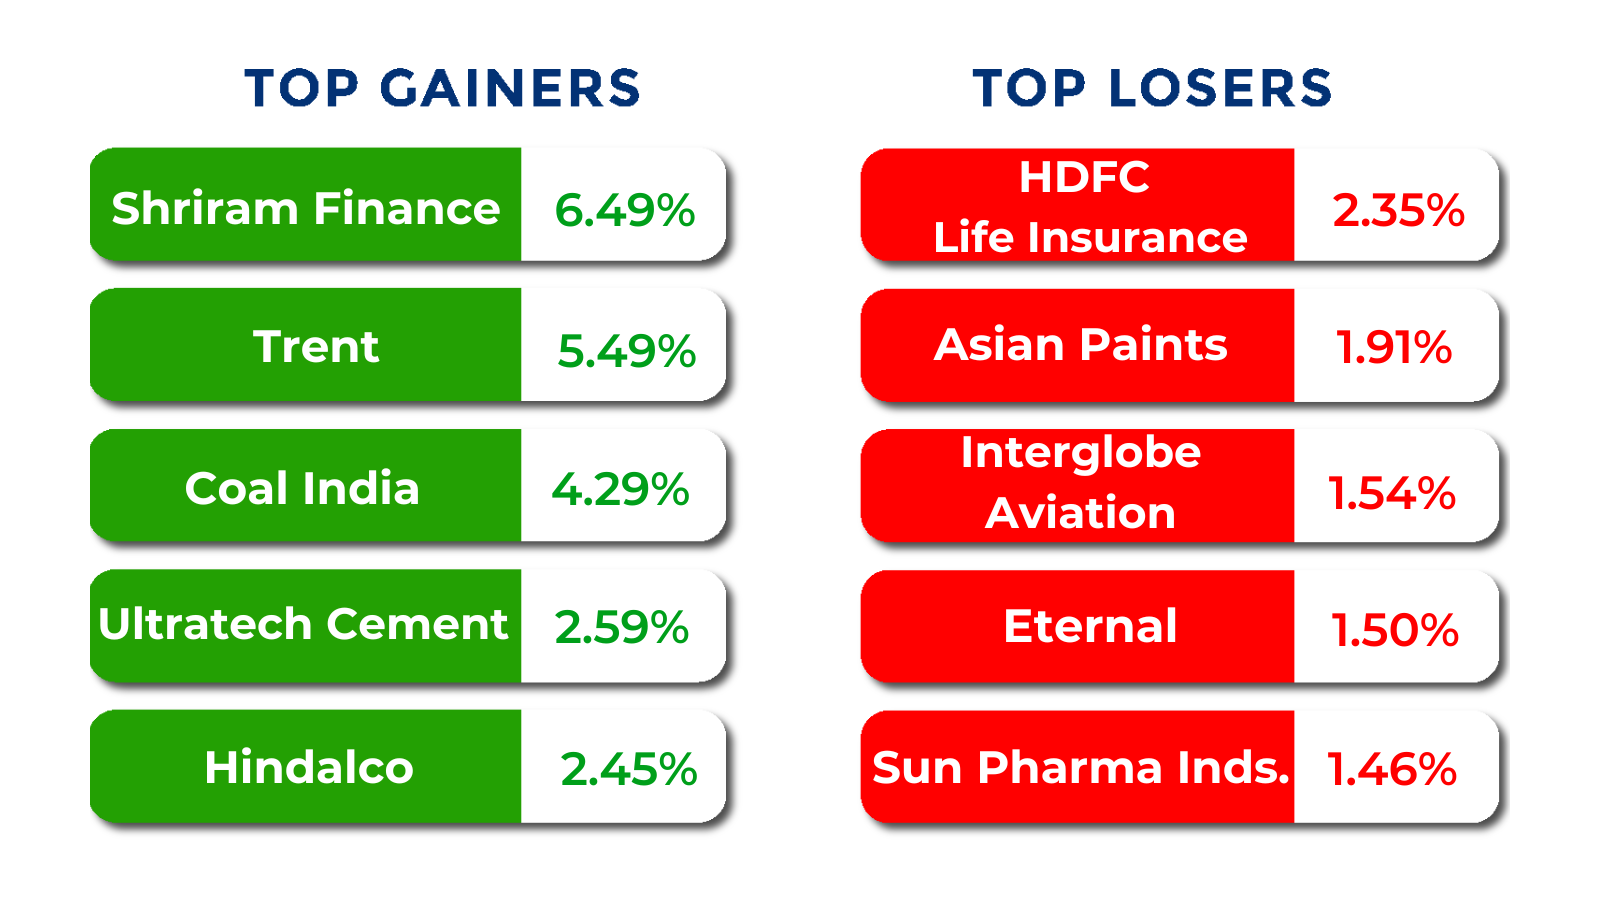
Top Gainers and Losers
Currency Chronicles
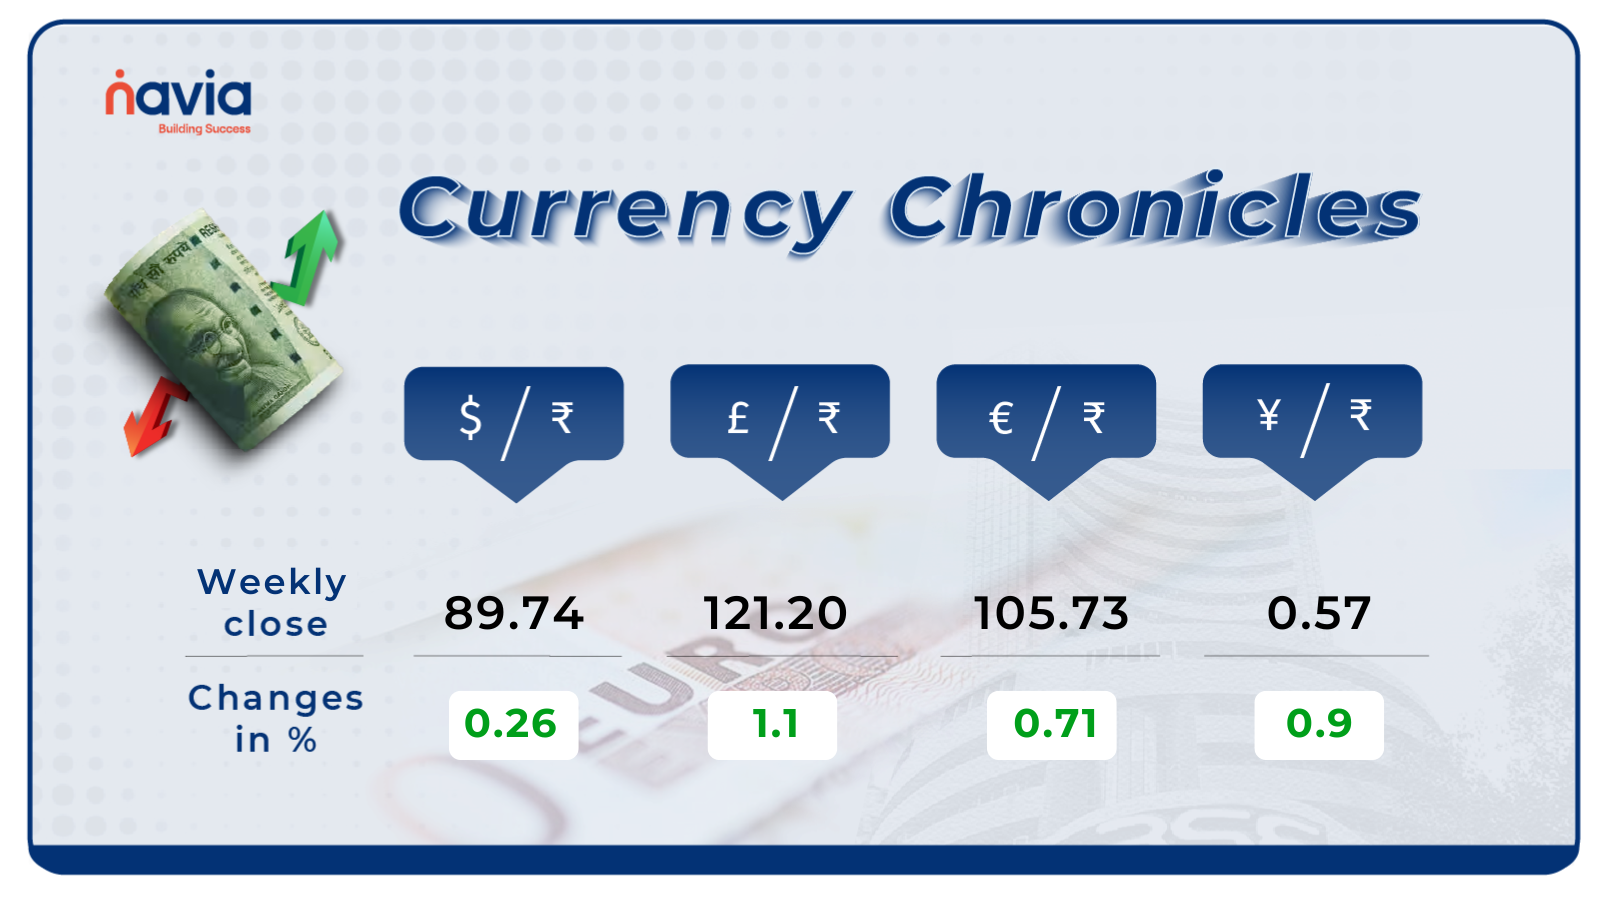
USD/INR:
The USD/INR rate closed at ₹89.74 per dollar, gaining 0.26% during the week, reflecting a bullish market sentiment.
EUR/INR:
The EUR/INR rate closed at ₹105.73 per euro, gaining 0.71% during the week, reflecting a bullish market sentiment.
JPY/INR:
The JPY/INR rate closed at ₹0.57 per yen, gaining 0.9% during the week, reflecting a bullish market sentiment.
Stay tuned for more currency insights next week!
Commodity Corner
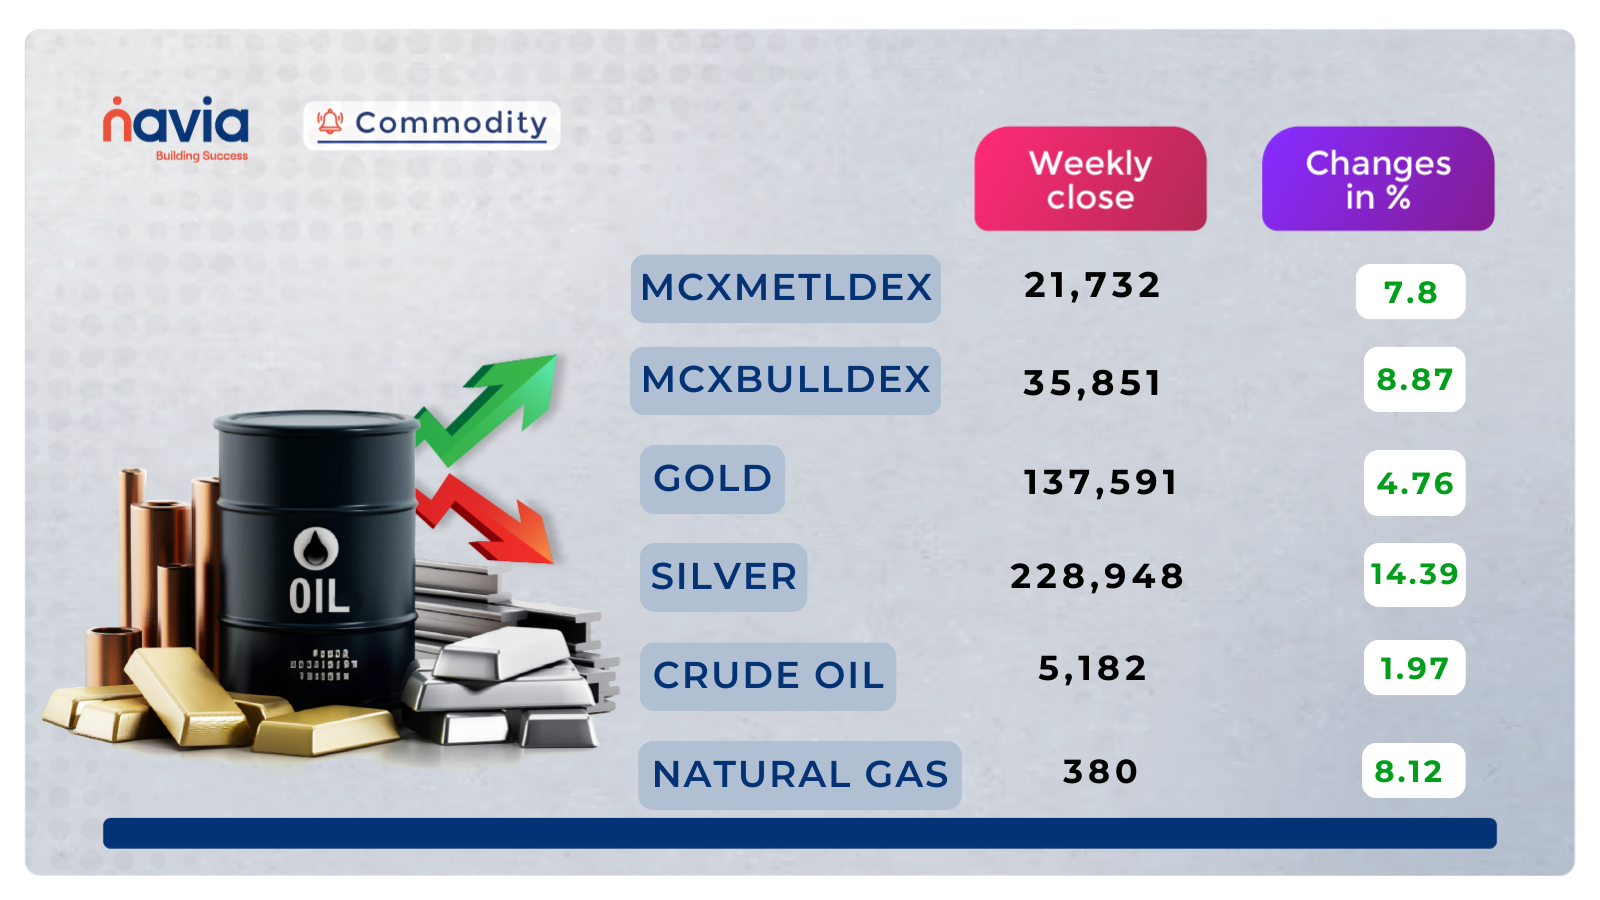
Crude Oil Futures continue to trade within a broader corrective structure after a prolonged downtrend, with price recently rebounding from the major demand zone near 5,010–5,050. The recovery has pushed prices back above the falling trendline support-turned-resistance area, indicating short-term relief buying; however, the overall structure remains range-bound and vulnerable near overhead supply. The 5,300–5,330 zone is acting as an immediate resistance cluster, aligned with prior consolidation and the descending trendline, where selling pressure may re-emerge. A sustained move above 5,330 would improve the short-term outlook and open room for a recovery toward 5,430, followed by 5,600. On the downside, 5,150–5,120 remains the key support band, and any failure to hold this zone could drag prices back toward the 5,010 base. Until a decisive breakout occurs, Crude Oil is likely to remain volatile within this defined range, favoring level-based trades rather than aggressive trend positions.
Gold Futures continue to maintain a strong bullish structure, trading within an upward-sloping channel after a successful trend reversal from the earlier corrective phase. Price has decisively moved above the previous consolidation zone and is now sustaining near the upper boundary of the rising channel around 138,000–138,300, indicating healthy momentum and controlled consolidation at higher levels. This price behavior suggests accumulation rather than distribution. The immediate support is placed near 136,800–137,200, aligned with the lower channel support and prior breakout base. As long as Gold holds above this zone, the broader trend remains firmly positive. A sustained breakout above 138,500 could open the path toward 140,000 and 142,000 in the near term. Any failure to hold 136,800 may invite a deeper pullback toward 135,200, though the overall bias remains bullish unless the rising channel is decisively broken.
Natural Gas Futures remain under corrective pressure after breaking down from the earlier rising channel, indicating a shift from bullish momentum to a volatile consolidation phase. The sharp sell-off from the 470–490 zone formed a strong bearish leg, followed by a rebound from the major demand area near 345–350. The recent pullback from higher levels suggests that the recovery is facing supply pressure around 400–410, which coincides with a prior breakdown zone and acts as a critical resistance. As long as prices remain below this resistance band, the broader bias stays cautious to bearish. On the downside, 360–350 continues to be the key support region; a sustained break below this zone could reopen downside risk toward 335–320. A decisive close above 410 would be required to confirm trend reversal and open the path toward 430–450. Until then, Natural Gas is likely to remain range-bound with high volatility, favoring short-term, level-based trading.
Do you have a question? Ask here and we’ll publish the information in the coming weeks.
Top Blogs of the Week!
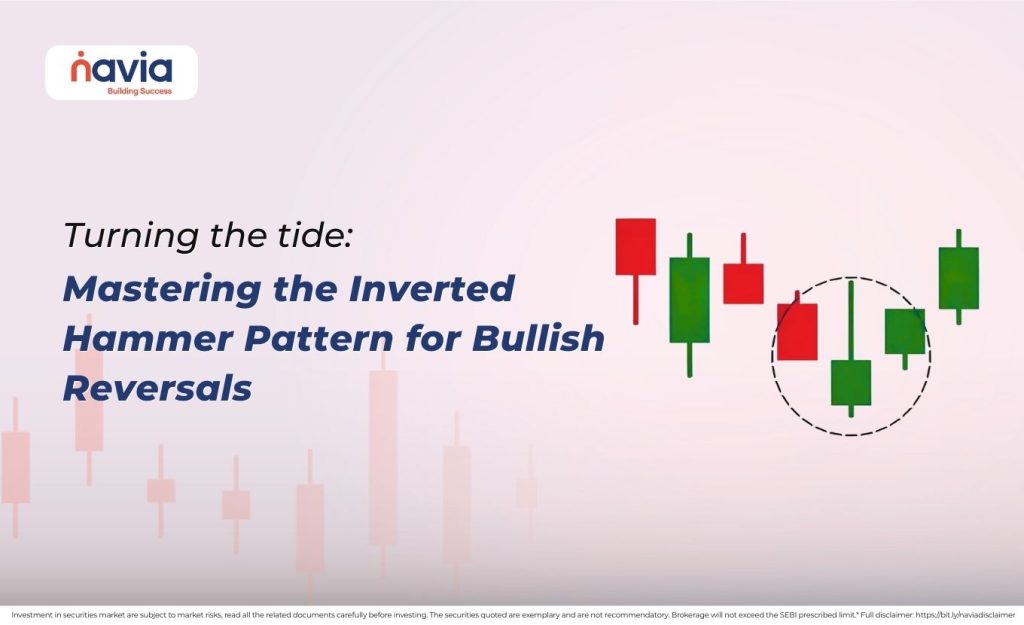
Turning the Tide: Mastering the Inverted Hammer Pattern for Bullish Reversals
The Inverted Hammer is a distinctive single-candle signal that marks the potential end of a downtrend, showing that buyers are finally pushing back against bearish pressure.

Dark Clouds on the Horizon: Understanding the Bearish Dark Cloud Cover Pattern
The Dark Cloud Cover is a potent two-candle bearish reversal pattern that signals a sudden shift from bullish optimism to bearish dominance at the peak of an uptrend.
N Coins Rewards

Refer your Friends & Family and GET 500 N Coins.
Do You Find This Interesting?

DISCLAIMER: Investment in securities market are subject to market risks, read all the related documents carefully before investing. The securities quoted are exemplary and are not recommendatory. Full disclaimer: https://bit.ly/naviadisclaimer.