Navia Weekly Roundup (Apr 1 – 4, 2025)
Week in the Review
Indian equity market snapped two-week gaining streak amid fears of a trade war, which led to global sell-off following US President’s reciprocal tariff announcements and renewed concerns over the economic slowdown.
Indices Analysis
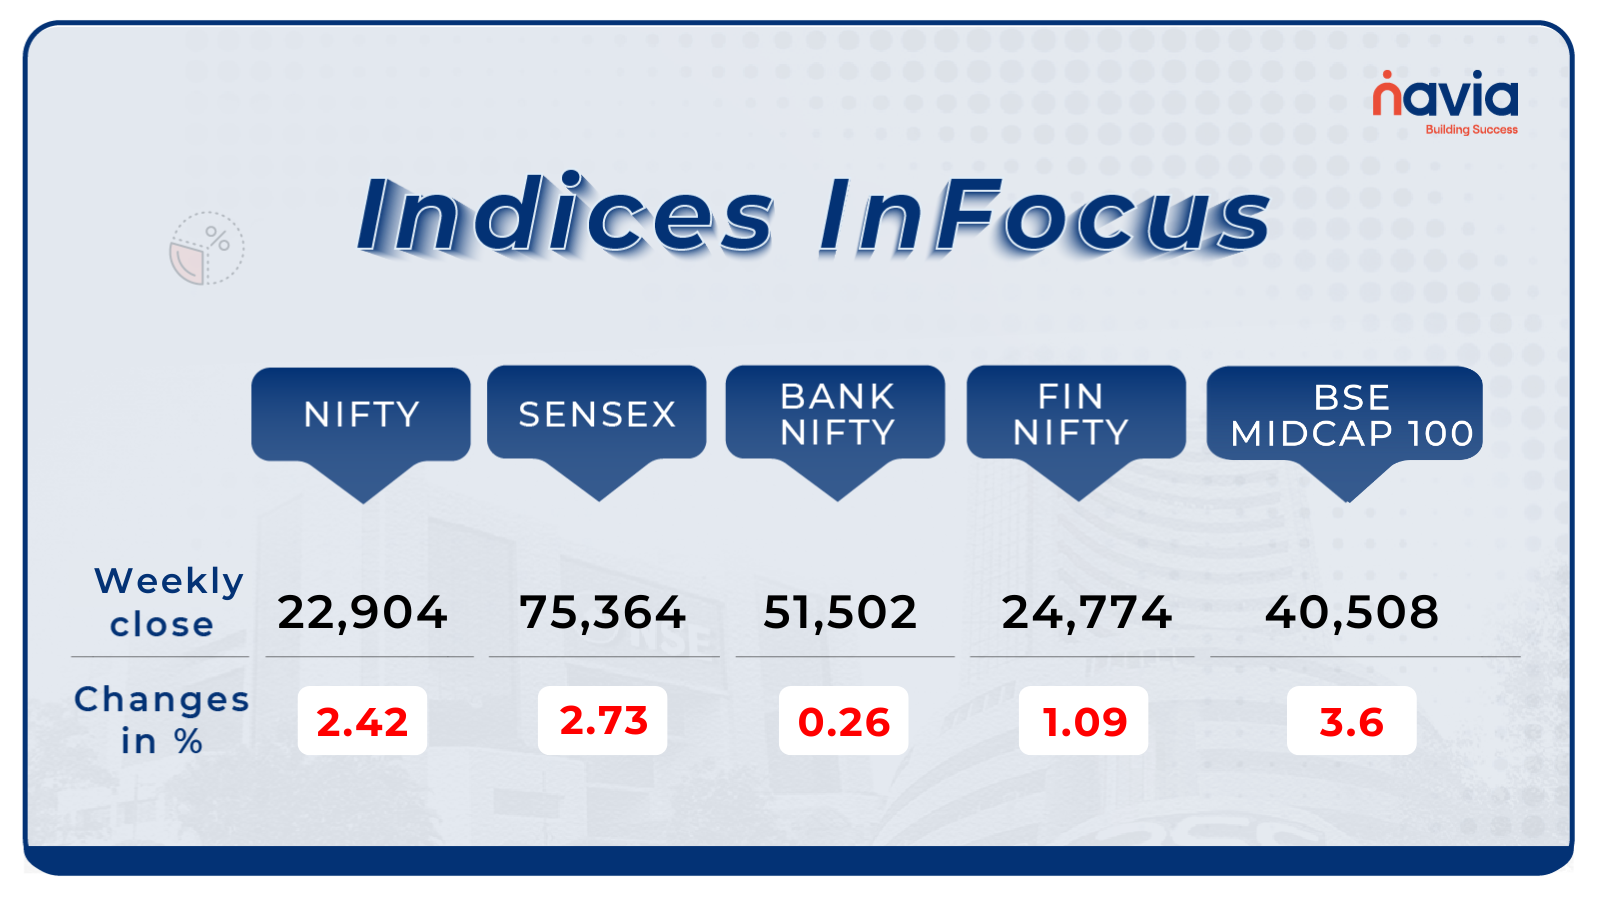
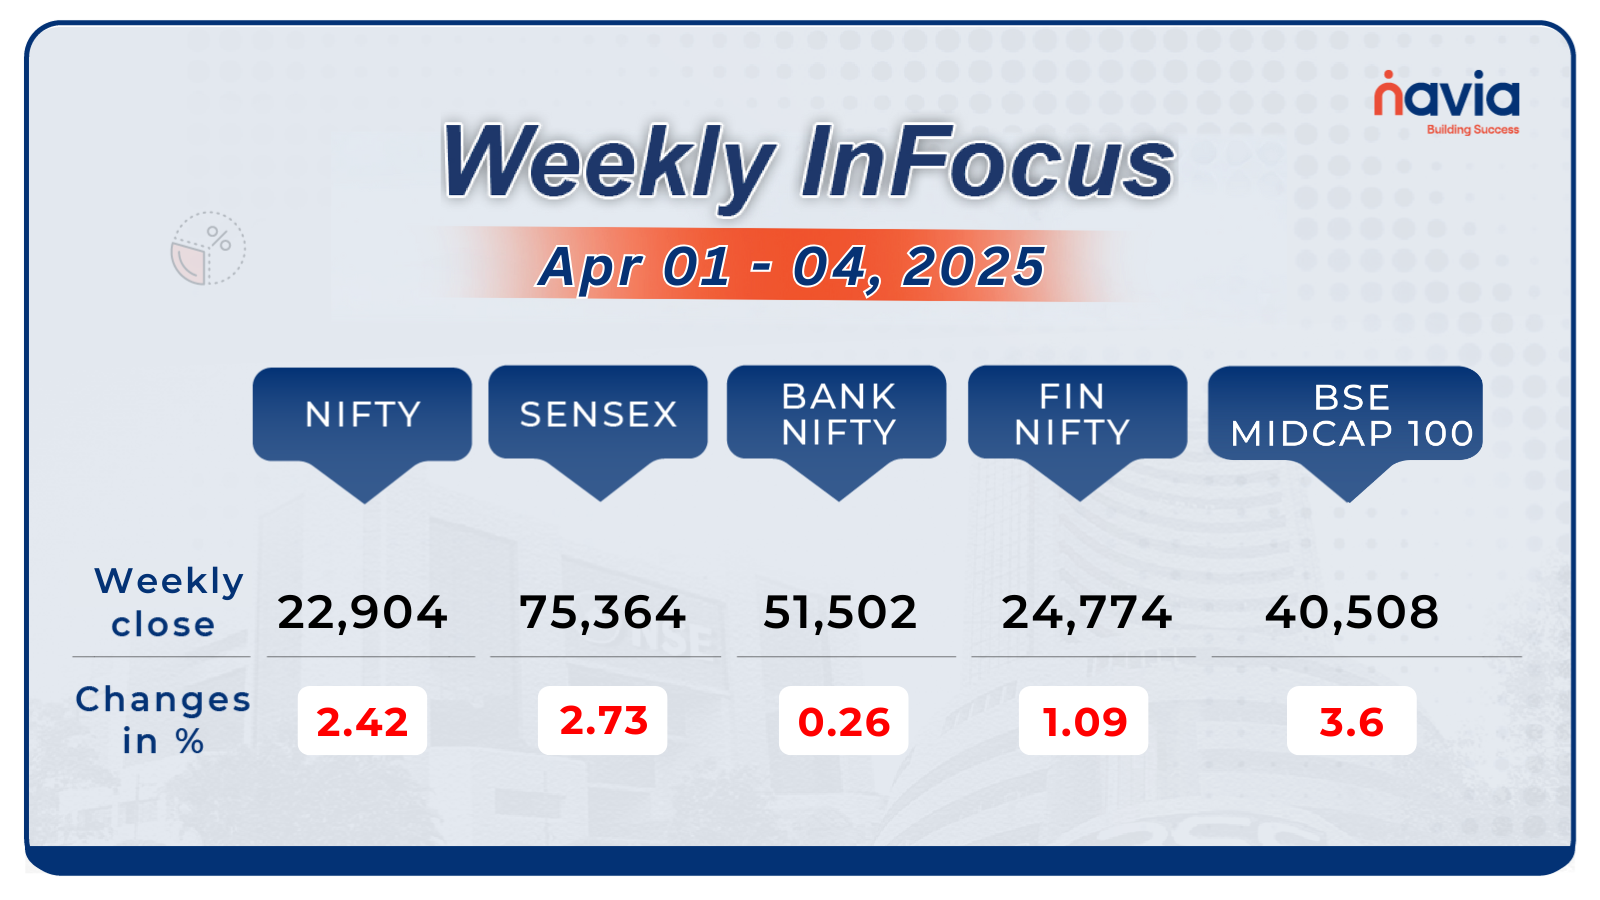
For the week, the BSE Sensex index shed 2050.23 points or 2.73 percent to close at 75,364.69, and Nifty50 fell 614.9 points or 2.42 percent to end at 22,904.45.
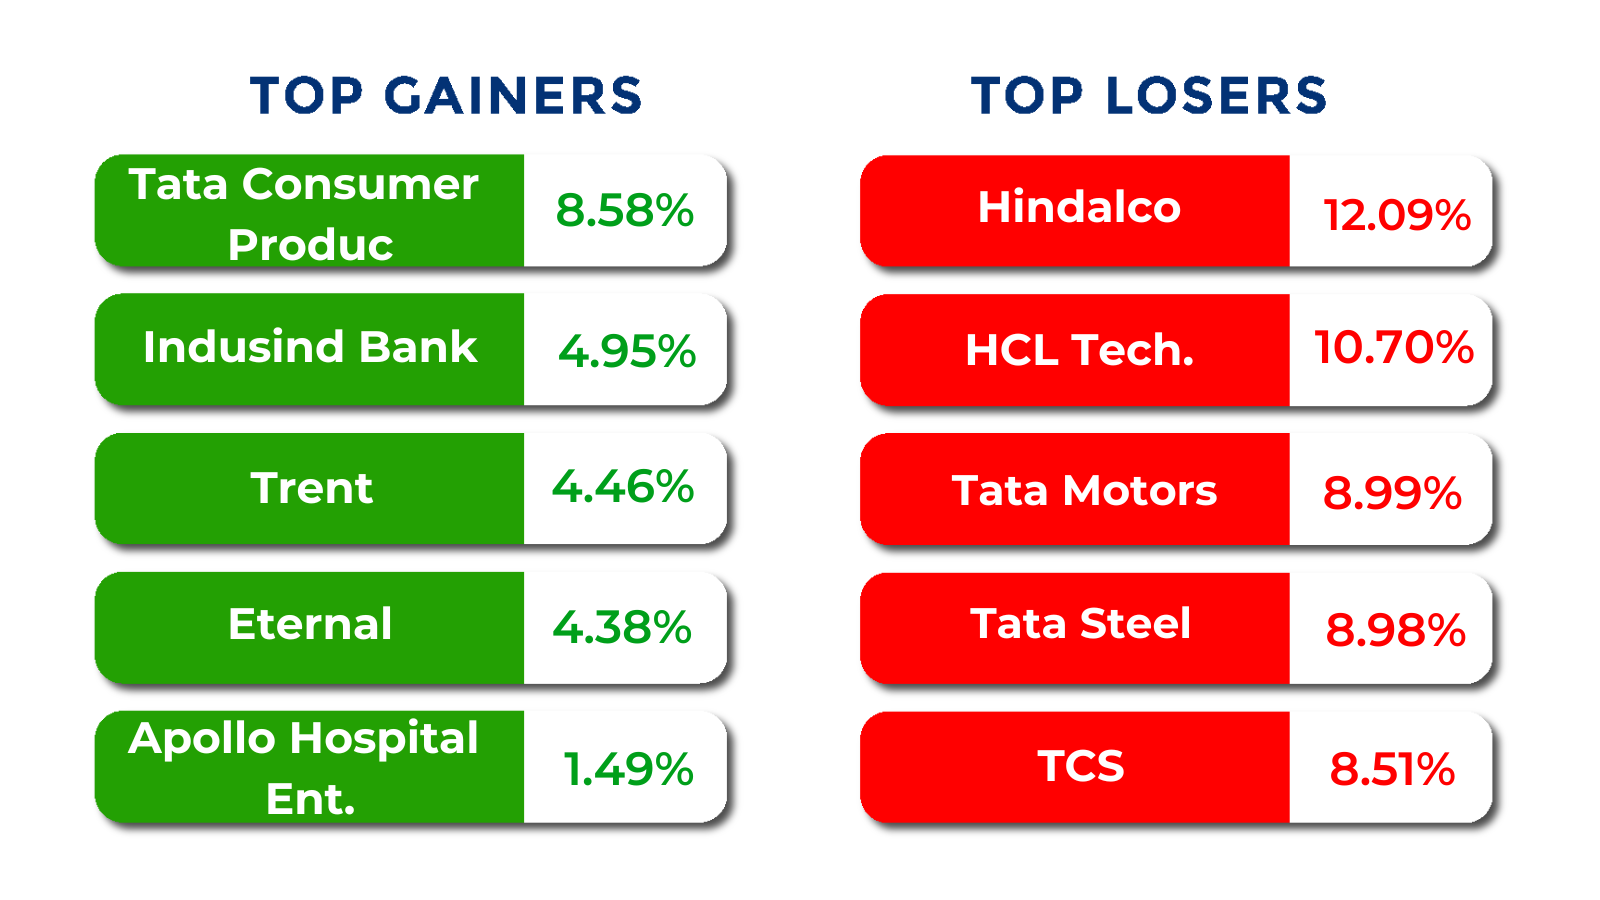
The BSE Large-cap Index plunged 2.5 percent dragged by Dabur India, Bajaj Holdings & Investment, HCL Technologies, Waaree Energies, Info Edge India, Tata Consultancy Services, Vedanta, while gainers included IndusInd Bank, Indus Towers, Tata Consumer Products, Trent, Canara Bank.
Interactive Zone!
Test your knowledge with our Markets Quiz! React to the options and see how your answer stacks up against others. Ready to take a guess?
Sector Spotlight
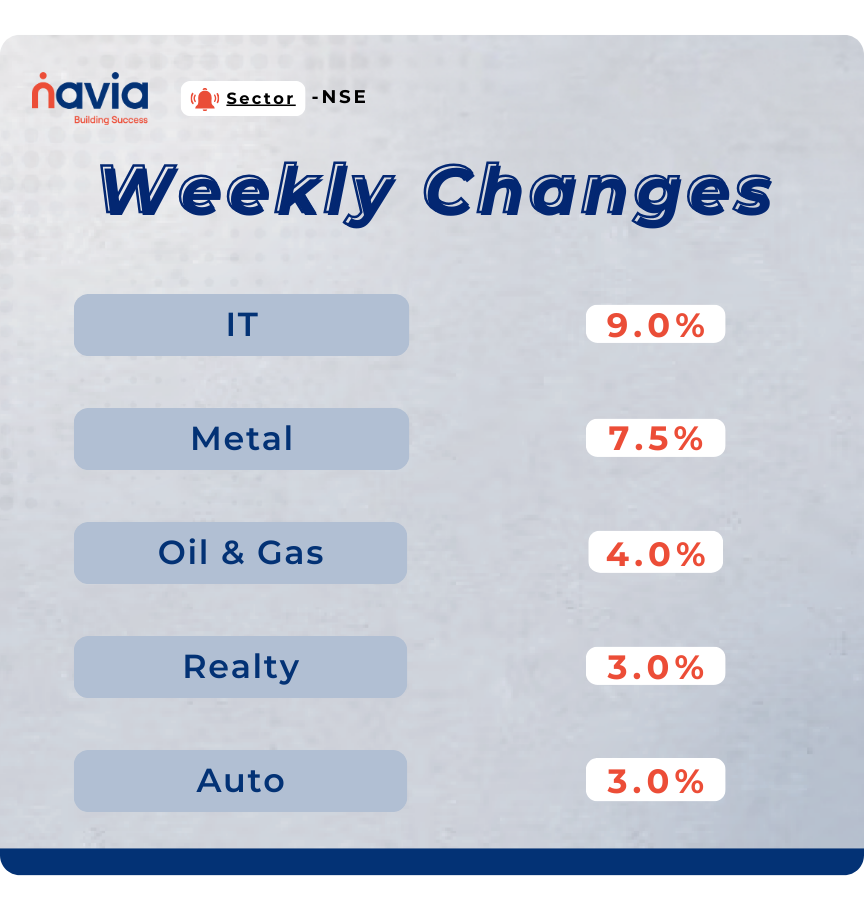
On the sectoral front, Nifty Information Technology index records biggest weekly fall of 9 percent since COVID 2020 on global growth concerns. Nifty Metal index down 7.5 percent, Nifty Oil & Gas index shed 4 percent, while Nifty Realty and Auto indices slipped 3 percent each.
Top Gainers and Losers
Currency Chronicles
USD/INR:
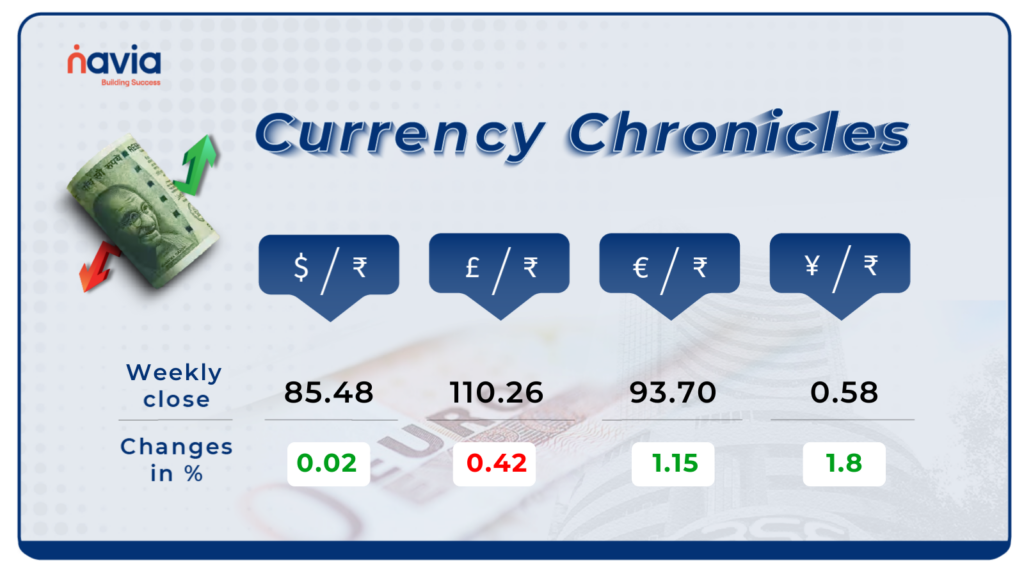
The Indian rupee extended the gains against the US dollar as it ended higher at 85.48 per dollar on April 4 against the March 28 closing of 85.46.
EUR/INR:
The sentiment in the EUR/INR market appears to be bullish, with the EUR to INR exchange rate reached ₹93.70 by the end of the week.
JPY/INR:
The sentiment in the JPY/INR market is considered bullish, the JPY to INR rate reached ₹0.58 by the end of the week.
Stay tuned for more currency insights next week!
Commodity Corner
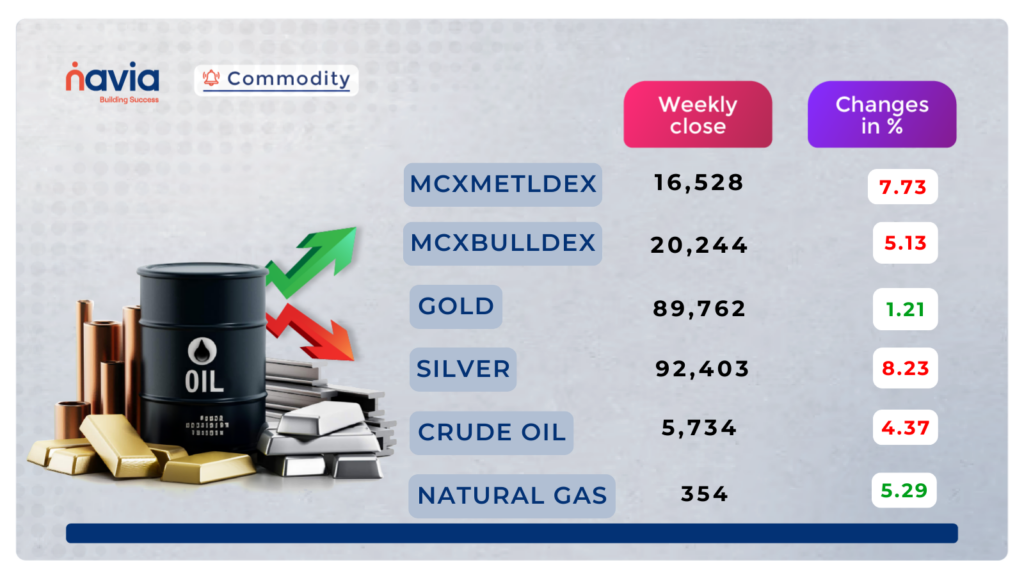
Crude oil experienced a strong sell-off in the last session, closing at 5,734, down by 412 points. Further momentum is expected above 5768 for an upside move or below 5690 for a downside move. A potential breakout toward the upside is anticipated in the coming days. Further decline can be expected if crude oil holds below the 5780 range.
Gold experienced significant volatility in the last session, trading within an ascending channel on the 4-hour chart. It closed at 89,762, down by 671 points, while taking support from the lower range of the ascending channel, as shown in the chart. If gold sustains above the 89,800–90,000 range, further upward momentum is expected. The ascending channel’s resistance is placed in the 91,300–91,500 range. For intraday trades, movement above 90,700 may signal an upside move, while a dip below 89,700 could indicate a downside move.
Natural gas is trading in a descending broadening wedge pattern on the 15-minute chart, with a possible retest toward the 330 range. If it sustains above 367, further positive momentum could follow. Another intraday move can be expected above 355 for further upside or below 350 for downside momentum. The last session closed up by 6 points, settling at 354.
Do you have a question? Ask here and we’ll publish the information in the coming weeks.
Blogs of the Week!
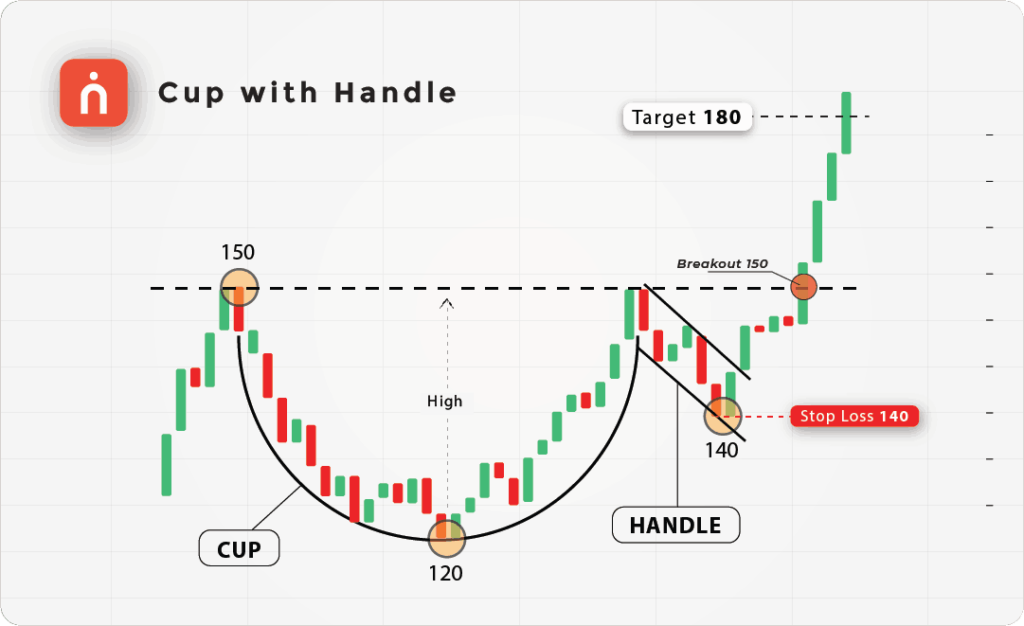
Understanding the Cup and Handle Pattern in Technical Analysis
The Cup and Handle pattern is a bullish continuation signal that resembles a tea cup, indicating a pause before the uptrend resumes. It forms with a rounded dip followed by a small pullback, then breaks out with strong momentum.

Get Instant Trade Reports on WhatsApp with Navia Markets’ BO Chatbot
Get trade reports in seconds with Navia’s BO Chatbot on WhatsApp — no logins, no waiting. From contract notes to portfolio summaries, everything you need is just a message away. Fast, secure, and available 24/7 — smarter trading starts here.
N Coins Rewards

Refer your Friends & Family and GET 500 N Coins.
Do You Find This Interesting?


