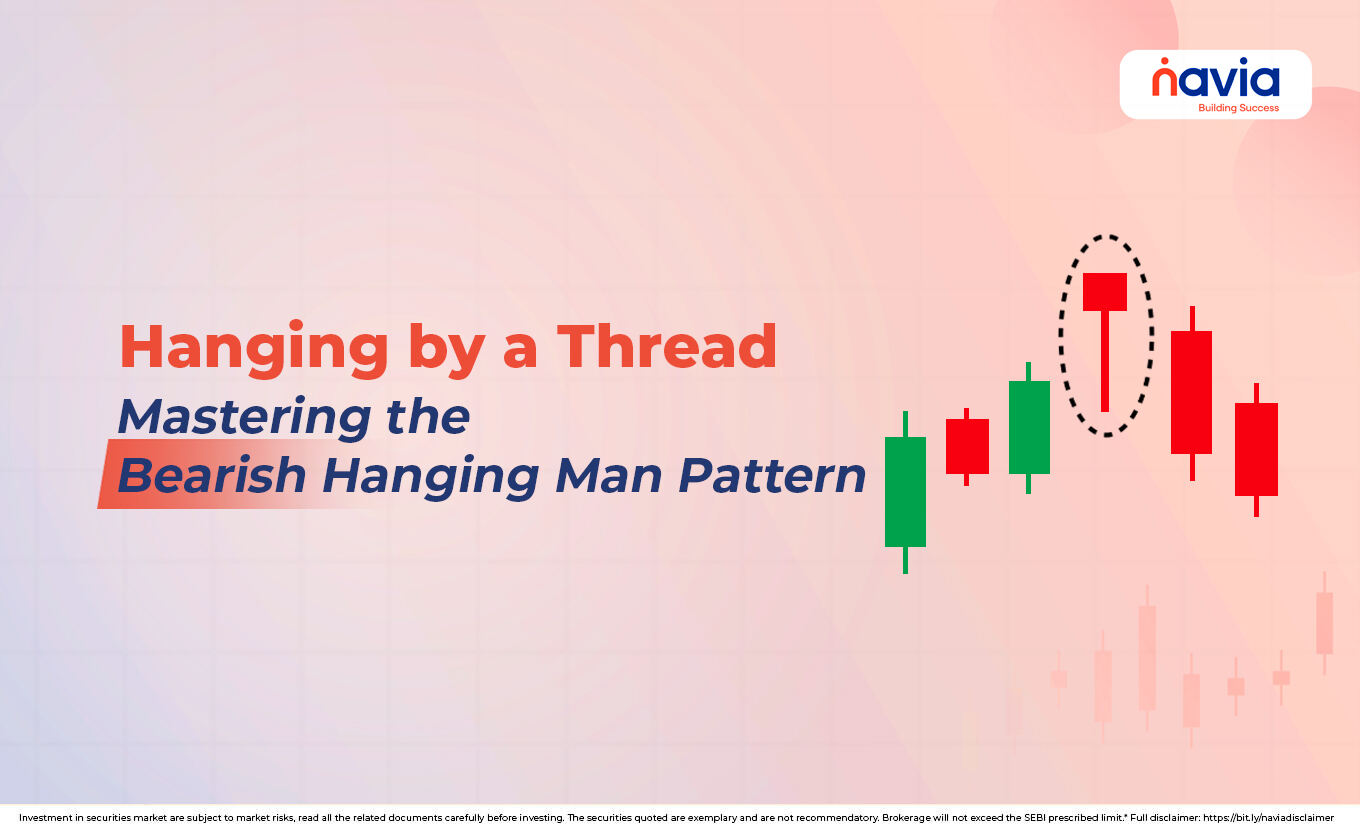
Hanging by a Thread: Mastering the Bearish Hanging Man Pattern
In technical analysis, traders look for clear signals that the market is about to change direction. Few signals of it like as a dramatic and foreboding as the hanging man pattern. It is a one-candle warning that the buyers (bulls) who propelled the price higher have become exhausted, and sellers (bears) are beginning to test the market floor.
Hanging man candlestick pattern is visually like few other candlestick formations, but the specific context and positioning of the pattern is crucial to determine bearish implications. By understanding it, you can protect your gains (for investors) or get a reliable reversal signal (for traders) without wasting your time.
This guide will explain the structure, psychology, and trading strategy that are required to get profit from this key reversal indicator.
What is the Hanging Man Pattern?
The hanging man pattern is a single-candlestick bearish reversal pattern, that forms at the peak of an established uptrend and signals a shift to a downtrend. The name “Hanging Man” comes from the candle’s shape, which said to resemble a hanging person with the small real body near the top and a long lower shadow stretching below.
The most important factor is to identify the location of the valid hanging man pattern candlestick. It must appear after a strong and clear uptrend. If it is formed during a downtrend, that is called “Hammer” and has the exact opposite (bullish) implication. So, remember to check the location before making a decision.
Anatomy of the Hanging Man Candlestick
The structure of the hanging man candlestick is defined by three major visual features, that are given below;
| Small Real Body at the Top | It has a very small real body that is positioned at the top of the price range. It indicates that the open and close prices were close to each other, often suggesting a slight gain/loss for the session. |
| Long Lower Shadow | The lower wick or shadow must be at least two times the length of the real body. The long shadow shows that sellers aggressively pushed the price down during the session, but buyers managed to stage a rally close near the high. |
| Little to No Upper Shadow | It should be little to no shadow above the real body. That confirms the trading activity was concentrated below the opening/closing price. |
The color of the real body (green/bullish or red/bearish) is generally less important compared to the shape. But it can provide a minor enhancement to the signal:
Red Body (Bearish): If the close is lower than the open, suggesting a slightly stronger bearish bias, the buyers fail to recover all the losses caused by the initial selling pressure.
Green Body (Bullish): If the close is higher than the open, the pattern is valid because the crucial long lower wick still shows the significant selling pressure that occurred mid-session.

Psychology Behind the Hanging Man Pattern
The candlestick patterns hanging man tells a dramatic story of shifting power dynamics in the market:
🔸 Opening Strength: The session begins with the price potentially continuing the uptrend.
🔸 Seller Dominance (The Drop): Sometimes aggressive selling enters the market; it is so powerful and that drives the price significantly down. This sudden drop is the key warning to traders.
🔸 Bullish Retaliation (The Recovery): Buyers are attempting to preserve the uptrend, stage a quick rally from the low, pushing the price back up to close near the open.
🔸 The Final Signal: Although the close is strong, the long lower shadow remains; that is the footprint of a severe bearish test of the market. It indicates the sellers have successfully probed deep into the market and, while beaten back temporarily, have shown they possess enough power to initiate a significant price drop.
The pattern warns that: “Bulls saved the day today, but the bears were strong enough to cause a huge mid-session route. Be prepared for them to try again tomorrow.”
How to Use the Hanging Man Pattern?
Now we understand that the hanging man pattern is a powerful warning, but that requires confirmation before committing to a trade. If you want to use this pattern, you should remember some basic steps like;
Context and Confirmation
Identify: Locate the hanging man candlestick at the top of an uptrend, and ensure the lower wick is at least double the size of the body.
Confirmation is Crucial: Never trade based on the single hanging man, you must wait for the next candle, the confirmation candle. Then only you can validate the bearish sentiment, if the confirmation candle is bearish (red/black) and its price closes below the low of the hanging man’s small real body. That confirms that the sellers successfully continued the downtrend.
Entry and Stop-Loss
After the confirmation;
Entry: Enter a short (sell) position when the price breaks and closes below the low of the hanging man’s real body. It ensures you only enter the trade after the bearish follow-through is confirmed.
Stop-Loss: Place your stop-loss order slightly above the height of the hanging man’s small real body. If the price rises past this level, the bearish reversal signal is invalidated, and the uptrend is likely resuming.
Take Profit: Target the nearest significant support level from prior price action or use a trailing stop-loss to manage the trade as the price moves downward.
Conclusion
The hanging man pattern considered as an indispensable warning tool for any market participant. That provides an immediate, visual clue that the market’s long-term trend may be shifting. By understanding the psychology of the deep mid-session sell-off represented by the long lower shadow, and by strictly adhering to the confirmation and risk management steps.
Understanding the psychology of the long lower shadow and strictly adhering to the confirmation and risk management steps will protect your capital from a falling market. But don’t ignore the classic signal—it is one of the clearest indications that the market is truly “hanging a thread.”
Do You Find This Interesting?
We’d Love to Hear from you-

Frequently Asked Questions
Is hanging man bullish or bearish?
The Hanging Man pattern is a bearish reversal signal. It appears at the top of an established uptrend and indicates that the selling pressure encountered during the period was significant enough to signal a likely shift in momentum from buying (bullish) to selling (bearish).
What is a hanging man candle pattern?
The Hanging Man candle pattern is a single-candlestick formation that occurs after an uptrend. It is characterized by a small real body positioned near the top, a long lower shadow (at least twice the length of the body), and little to no upper shadow. The long lower shadow shows a deep intra-session sell-off, which, despite being recovered by the close, signals critical underlying weakness in the trend.
What is the difference between hammer and hanging man?
The difference between the Hammer and the Hanging Man is purely based on their location on the price chart, as they have the exact same structure:
| Feature | Hanging Man | Hammer |
| Market Context | Forms at the top of an uptrend. | Forms at the bottom of a downtrend. |
| Signal Implication | Bearish Reversal (Sell Signal). | Bullish Reversal (Buy Signal). |
| Psychology | Bulls are losing grip; strong seller tests. | Sellers are exhausted; strong buyer entry. |
How to confirm Hanging Man?
To confirm the validity of the Hanging Man pattern, you must wait for the confirmation candle on the next trading period. The pattern is confirmed if the next candle is bearish (red) and closes below the low of the Hanging Man’s real body. This follow-through confirms that the sellers were able to continue the downtrend after the initial warning.
What are common mistakes in trading Hanging Man?
The most common mistakes when trading the Hanging Man pattern are:
◆ Trading without Confirmation: Entering a short position immediately after the Hanging Man forms, without waiting for the next candle to confirm the reversal.
◆ Misidentifying Location: Confusing the Hanging Man with the bullish Hammer by seeing the pattern in a downtrend.
◆ Ignoring Risk Management: Failing to place a tight stop-loss order above the high of the Hanging Man’s real body.
◆ Ignoring Context: Trading the pattern when it does not appear at a key resistance level or after a substantial, established uptrend.
DISCLAIMER: Investment in securities market are subject to market risks, read all the related documents carefully before investing. The securities quoted are exemplary and are not recommendatory. Full disclaimer: https://bit.ly/naviadisclaimer.