

Understanding the Descending Triangle Pattern in Technical Analysis
The Descending Triangle Pattern is a popular bearish continuation pattern in technical analysis, which signals that the price of a stock or asset is likely to break down lower after a period of consolidation. This pattern forms when the price makes lower highs, but consistently finds support at a horizontal level, creating a triangular shape with a downward slope. The pattern suggests that selling pressure is increasing, and once the price breaks below the support level, a downward move is expected.
In this article, we will explore the Descending Triangle Pattern, how to identify it, how it works, and how to trade it with numerical examples. We will also discuss target prices, stop-loss strategies, and the role of volume in confirming the pattern.
What is the Descending Triangle Pattern?
The Descending Triangle Pattern is formed by two key trendlines: a downward-sloping resistance line (connecting lower highs) and a horizontal support line (connecting equal lows). The price contracts within this triangular shape as it makes a series of lower highs while finding support at a certain price level. The pattern is complete when the price breaks below the horizontal support line, signaling a bearish continuation.
While the pattern is primarily a bearish continuation pattern, it can occasionally act as a reversal pattern if it forms after an uptrend.
Key Characteristics of the Descending Triangle Pattern
1. Lower Highs:
The price forms lower highs as it moves downwards, indicating that the buying pressure is weakening, and sellers are gradually gaining control.
2. Horizontal Support Line:
The price finds consistent support at a certain price level, forming a horizontal line. This support line is tested multiple times as buyers step in to prevent further declines.
3. Breakout:
The pattern is confirmed when the price breaks below the horizontal support line. This breakdown suggests that the sellers have overpowered the buyers, and the price is likely to move lower.
4. Volume:
Volume often decreases as the pattern develops, indicating a consolidation phase, but it typically spikes when the price breaks below the support level, confirming the downward move.
How to Identify the Descending Triangle Pattern
🠖 Spot the Downward-Sloping Resistance Line:
Identify a series of lower highs, indicating that sellers are becoming more aggressive and the price is failing to make higher peaks.
🠖 Identify the Horizontal Support Line:
Look for a support level where the price finds consistent support and fails to break lower. The support line should be flat or nearly flat.
🠖 Wait for the Breakout:
The pattern is confirmed when the price breaks below the support line with strong volume, signaling a continuation of the downtrend.
🠖 Measure the Target:
Measure the height of the pattern (the distance between the first high and the support level) and project that distance downward from the breakout point to set the target price.
Trading the Descending Triangle Pattern
Entry Point
Enter a short position when the price breaks below the horizontal support line with strong volume, confirming the breakout.
Stop-Loss
Place your stop-loss just above the most recent lower high to protect against a potential false breakout.
Target Price
The target price is calculated by measuring the height of the pattern (the distance between the highest point and the support line) and projecting that distance downward from the breakout point.
Numerical Example of a Descending Triangle Pattern
Let’s break down a simple example of a Descending Triangle Pattern using numbers.
| Action | Price (₹) | Description |
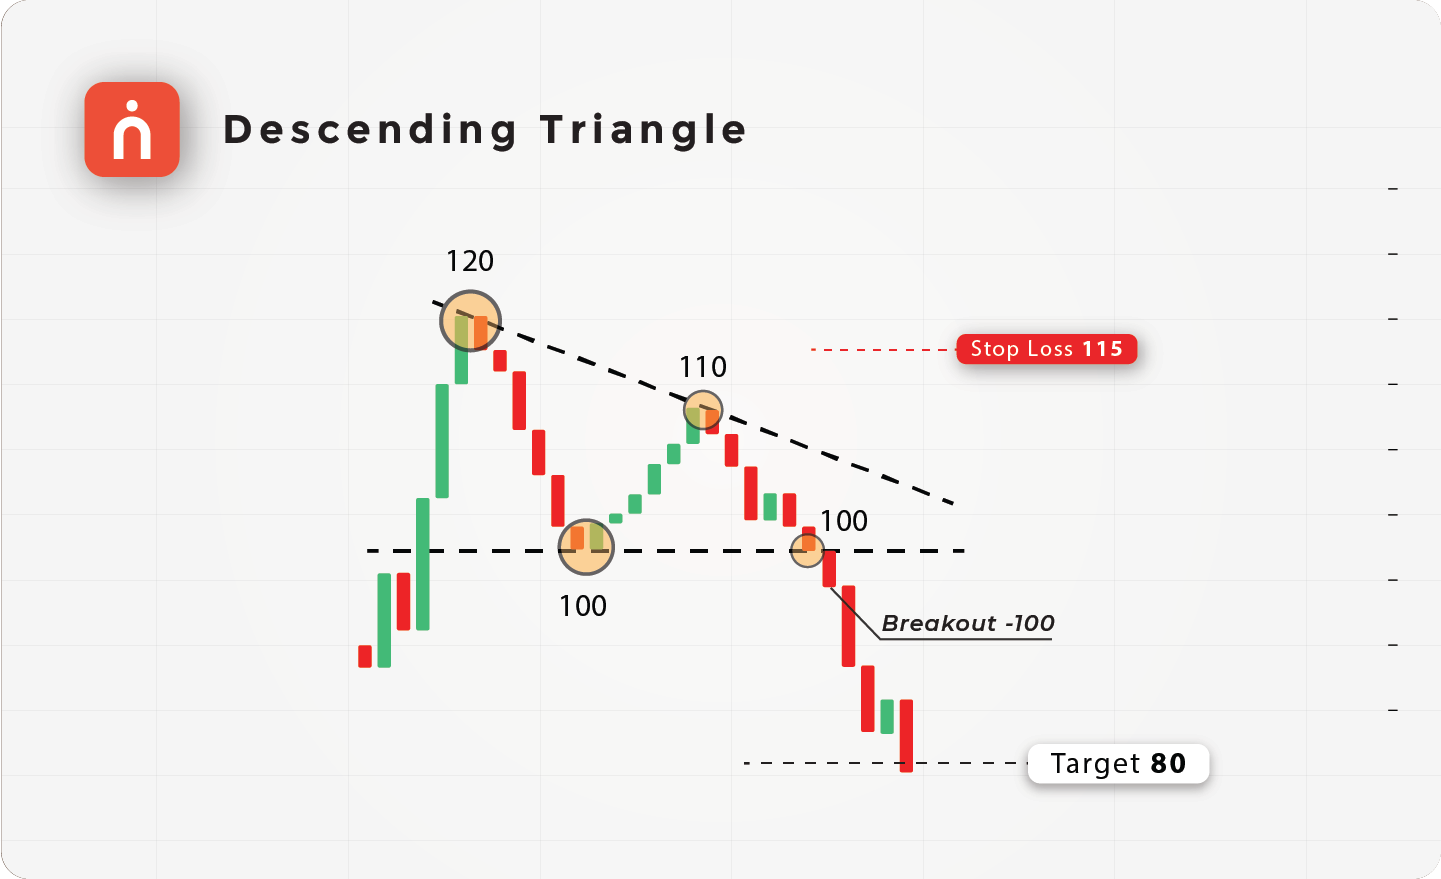
| First High | 120 | Price rises to ₹120, forming the first high |
| Support Level | 100 | Price declines to ₹100, forming the support line |
| Lower High | 110 | Price rises again to ₹110, forming a lower high |
| Second Test of Support | 100 | Price declines again to ₹100, confirming the support level |
| Breakout | 100- | Price breaks below ₹100 with strong volume |
| Target Price | 80 | Target = ₹100 – (₹120 – ₹100) = ₹80 |
| Stop-Loss | 115 | Stop-loss placed just above the lower high at ₹115 |
In this example, the price forms lower highs at ₹120 and ₹110, while consistently finding support at ₹100. After the second test of the support level, the price breaks below ₹100 with strong volume, confirming the bearish continuation. The target price is set at ₹80 based on the height of the pattern (₹120 – ₹100 = ₹20), and the stop-loss is placed just above the lower high at ₹115 to protect against a false breakout.
Significance of Volume in the Descending Triangle Pattern
Volume plays a crucial role in confirming the validity of the Descending Triangle Pattern:
Volume Decreases During Formation:
Volume tends to decrease as the pattern forms, indicating a period of consolidation. This reduction in volume suggests that the market is pausing before making a decisive move.
Volume Spike at Breakout:
A volume spike during the breakout below the support level confirms that selling pressure is intensifying and that the bearish continuation is likely. Without this volume confirmation, the breakout may be a false signal.
Example of a Descending Triangle Pattern with Volume Spike
Here’s another example of a Descending Triangle Pattern with volume:
| Action | Price (₹) | Volume | Description |
|---|---|---|---|
| First High | 200 | 1,00,000 | Price rises to ₹200, forming the first high |
| Support Level | 180 | 80,000 | Price declines to ₹180, forming the support line |
| Lower High | 190 | 75,000 | Price rises again to ₹190, forming a lower high |
| Second Test of Support | 180 | 70,000 | Price declines again to ₹180, confirming the support level |
| Breakout | 180- | 1,40,000 | Price breaks below ₹180 with a volume spike |
| Target Price | 160 | Target = ₹180 – (₹200 – ₹180) = ₹160 | |
| Stop-Loss | 195 | Stop-loss placed just above the lower high at ₹195 |
In this case, the price forms lower highs at ₹200 and ₹190, while consistently finding support at ₹180. After testing the support level twice, the price breaks below ₹180 with a volume spike from 70,000 shares to 1,40,000 shares, confirming the bearish continuation. The target price is set at ₹160, and the stop-loss is placed above the lower high at ₹195 to protect against a false breakout.
When Does the Descending Triangle Pattern Occur?
The Descending Triangle Pattern typically forms during a downtrend, acting as a continuation pattern. It indicates that the price is consolidating before continuing the downtrend. However, in some cases, the pattern can act as a reversal pattern if it forms after an uptrend.
The pattern is most effective when it forms over a longer time frame (daily, weekly, or monthly charts) and is confirmed by a volume increase during the breakout below the support level.
Trading Strategies for Descending Triangle Patterns
1. In Bearish Markets:
The Descending Triangle Pattern is a bearish continuation signal, and traders can look for short-selling opportunities when the price breaks below the support level.
2. Volume-Based Confirmation:
A volume spike during the breakout confirms the strength of the bearish move. If the breakout occurs with low volume, it could indicate a false breakout.
4. Target and Stop-Loss Setting:
Use the height of the pattern to set a realistic target price, and place your stop-loss just above the most recent lower high to protect against false signals.

Conclusion
The Descending Triangle Pattern is a reliable bearish continuation pattern that signals the potential continuation of a downtrend after a period of consolidation. By identifying the downward-sloping resistance line, horizontal support line, and waiting for a volume-confirmed breakout, traders can capitalize on the pattern’s potential for profits.
With well-defined entry points, stop-loss levels, and target prices, the Descending Triangle Pattern offers a structured and relatively low-risk strategy for traders looking to profit from bearish market continuations. By paying close attention to volume spikes during the breakout, traders can confirm the validity of the pattern and avoid false signals.
Do You Find This Interesting?
We’d Love to Hear from you-

DISCLAIMER: Investments in the securities market are subject to market risks, read all the related documents carefully before investing. The securities quoted are exemplary and are not recommendatory. Brokerage will not exceed the SEBI prescribed limit.


