The Bearish Kicker Pattern: Mastering One of the Most Explosive Reversal Signals
- What is the Bearish Kicker Pattern?
- Anatomy of the Bearish Kicker Candlestick Pattern
- Market Psychology: A Violent Shift
- How to Trade the Bearish Kicker Pattern?
- Common Mistakes to Avoid
- Conclusion
- Frequently Asked Questions
In the high-velocity world of stock trading, many candlestick patterns signal a gradual shift in power—a slow transition where bulls lose steam and bear slowly take over. However, there is one pattern that represents a violent, instantaneous, and absolute coup: the Bearish Kicker Pattern.
If you are looking for a signal that marks a sudden “kick” to the gut of the bulls, this is it. This guide will break down why the bearish kicker candlestick pattern is considered one of the most reliable and high-conviction signals in a trader’s arsenal.
What is the Bearish Kicker Pattern?
The bearish kicker pattern is a two-candle reversal formation that signals a sudden and dramatic change in market sentiment. Unlike many other patterns that require a “confirmation” day or a series of smaller candles, the Kicker is characterized by a massive gap that completely ignores the previous day’s momentum.
It usually occurs at the peak of an uptrend or during a period of consolidation. The sheer force of the “kick” often leaves retail investors stranded in losing positions, while institutional “smart money” aggressively shorts the stock.
Anatomy of the Bearish Kicker Candlestick Pattern
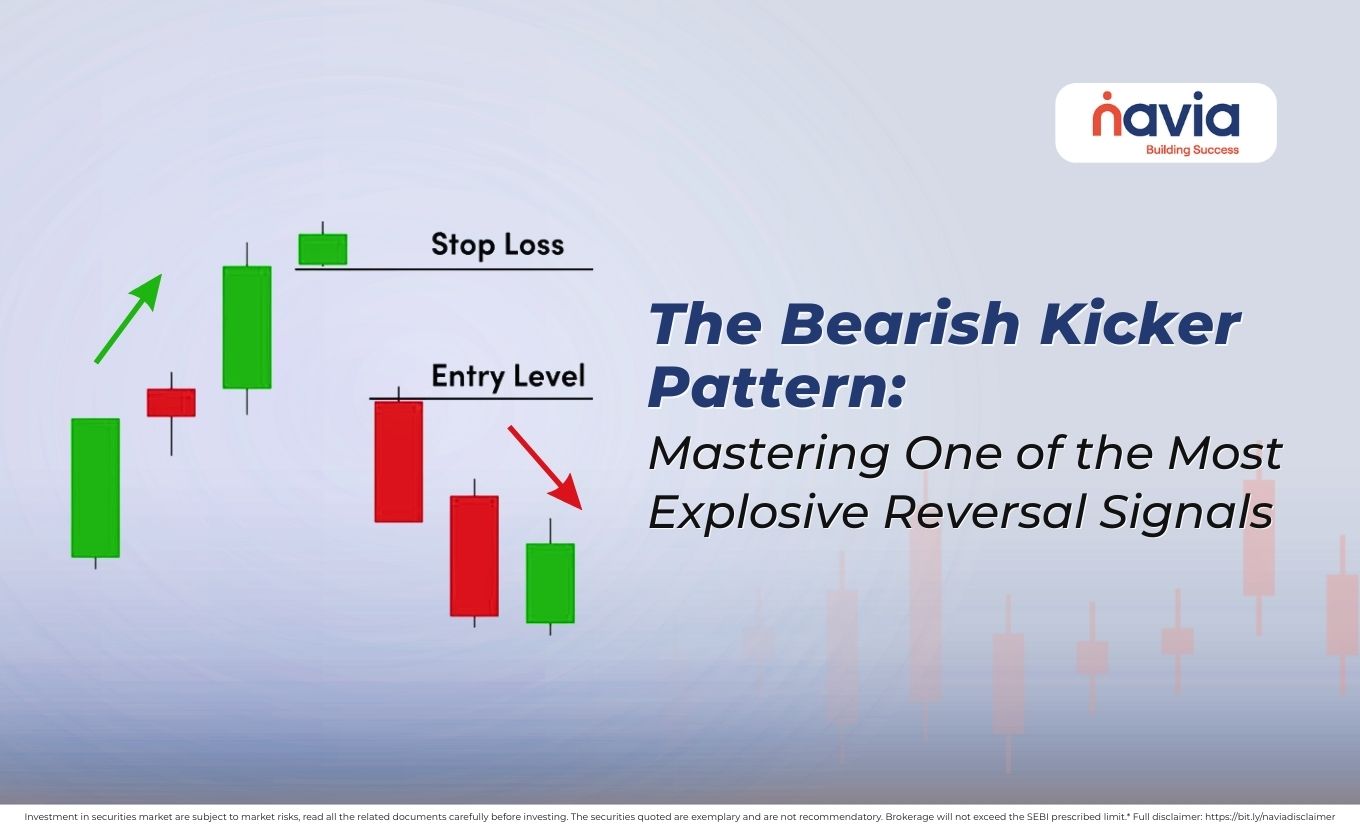
To identify a valid bearish kicker candlestick pattern, you must look for two specific candles with a very particular relationship. According to technical standards, the pattern must meet these three criteria:
| The First Candle (The Bullish Lead-In) | The pattern begins during an uptrend with a strong bullish (green/white) candle. At this point, the market looks healthy. There is no sign of weakness, and buyers seem to be in total control. |
| The Gap (The “Kick”) | The defining feature of the Kicker occurs between the first and second days. The second candle must gap down significantly. In a pure Kicker, the second candle opens at or below the opening price of the first day’s bullish candle. This means the market has completely “skipped” the entire price range of the previous day’s gains. |
| The Second Candle (The Bearish Resumption) | The second candle is a large bearish (red/black) candle. It moves further downward, closing well below its open. Ideally, both candles in this pattern should be “Marubozu” candles—meaning they have very small or no wicks—indicating that the momentum in both directions was absolute. |
Market Psychology: A Violent Shift
The psychology behind the bearish kicker candlestick pattern is what makes it so powerful.
Imagine you are a bull. On Day 1, you are celebrating a strong green candle. You expect the trend to continue. Suddenly, on Day 2, the stock opens massively lower, perhaps due to a surprise earnings report, a regulatory shift, or a sudden change in global sentiment.
Every single person who bought on Day 1 is now instantly “underwater” (in a loss). The shock causes a panic sell-off. Because the price gapped down so aggressively, there is no support left. The “kick” is so sudden that it shatters the bullish confidence, leading to a sustained downtrend.

How to Trade the Bearish Kicker Pattern?
In today’s markets, where algorithms often hunt for liquidity, the bearish kicker pattern provides a clear roadmap for entry and exit. Here you can see some of the strategies (educational purpose only) that help you trade with this pattern.
| Entry Strategy | The Kicker is such a strong signal that many traders enter a “Short” position immediately after the second candle closes. However, for those looking for extra security, you can wait for the price to break the low of the second candle on the following day. |
| Stop-Loss Placement | The most logical place for a stop-loss is just above the opening price of the first (bullish) candle. Since the gap is the most important part of this pattern, if the price moves back up to fill that gap and surpass the original open, the bearish thesis is invalidated. |
| Profit Targets | Bearish Kickers often lead to long-term downtrends. Look for the next major support zone on a daily or weekly chart. In 2026, many traders use a 2:1 or 3:1 reward-to-risk ratio, trailing their stops to capture the full move. |
Common Mistakes to Avoid
🔸 Trading in a Sideways Market: A bearish kicker pattern is most effective when it appears after a clear uptrend. If the market is moving sideways, the “gap” might just be random noise.
🔸 Ignoring Volume: Always check the volume on the second day. A true bearish kicker candlestick pattern should be backed by a massive surge in volume, confirming that institutions are dumping their shares.
🔸 Failing to check the “News”: While technicals are great, Kickers are often triggered by fundamental news. Knowing why the gap happened (e.g., a scandal or bad earnings) can give you more confidence to hold the trade.
Conclusion
The bearish kicker candlestick pattern is not a subtle hint; it is a loud alarm. It tells you that the trend has changed in an instant and that the bulls have no defense left. By recognizing this pattern on your charts, you can avoid being caught on the wrong side of a market crash and instead position yourself to profit from the descent.
In 2026, as trading and technology move faster than ever, the Kicker remains one of the few patterns that can cut through the noise and show you the raw, unfiltered truth of market sentiment.
Do You Find This Interesting?
We’d Love to Hear from you-

Frequently Asked Questions
What is a bearish kicker candle pattern?
A bearish kicker candle pattern is a two-bar reversal signal that represents a violent shift from bullish to bearish sentiment. It starts with a strong green (bullish) candle, followed by a massive gap down. The second candle opens at or below the opening price of the first candle and continues to move downward, closing as a large red (bearish) candle. It is one of the most powerful signs that a downtrend has begun.
What is the strongest bearish pattern?
While “strength” can depend on the timeframe, the Bearish Kicker is widely considered the strongest and most explosive bearish pattern because of the price gap.
What is a bullish kicker?
The Bullish Kicker is the mirror image of the bearish version. It occurs during a downtrend and signals an immediate reversal to the upside:
✔ First Candle: A strong bearish (red) candle.
✔ The Gap: A massive gap up where the second candle opens at or above the opening of the first candle.
✔ Second Candle: A strong bullish (green) candle that moves upward, leaving the bears “kicked” out of their positions.
How to confirm a bullish candle signal?
To ensure a bullish signal isn’t a “fakeout,” look for these three factors:
1. Next Candle Close: Wait for the following candle to close above the high of the signal candle.
2. Volume Spike: The signal candle should have significantly higher trading volume than the previous few candles, indicating institutional buying.
3. Support Level: The pattern is much stronger if it forms near a major support zone or a moving average.
How do I confirm a bearish candlestick?
Confirmation is the key to avoiding “bull traps.” Follow these steps:
🔹 The Follow-Through: Look for the next candle to open and close below the low of the bearish signal candle.
🔹 RSI Divergence: Check if the Relative Strength Index (RSI) was in the overbought zone or showing a “lower high” while the price made a “higher high.”
🔹 Break of Support: A bearish candlestick is most reliable when it results in the price breaking below a recent support line or a trendline.
DISCLAIMER: Investment in securities market are subject to market risks, read all the related documents carefully before investing. The securities quoted are exemplary and are not recommendatory. Full disclaimer: https://bit.ly/naviadisclaimer.