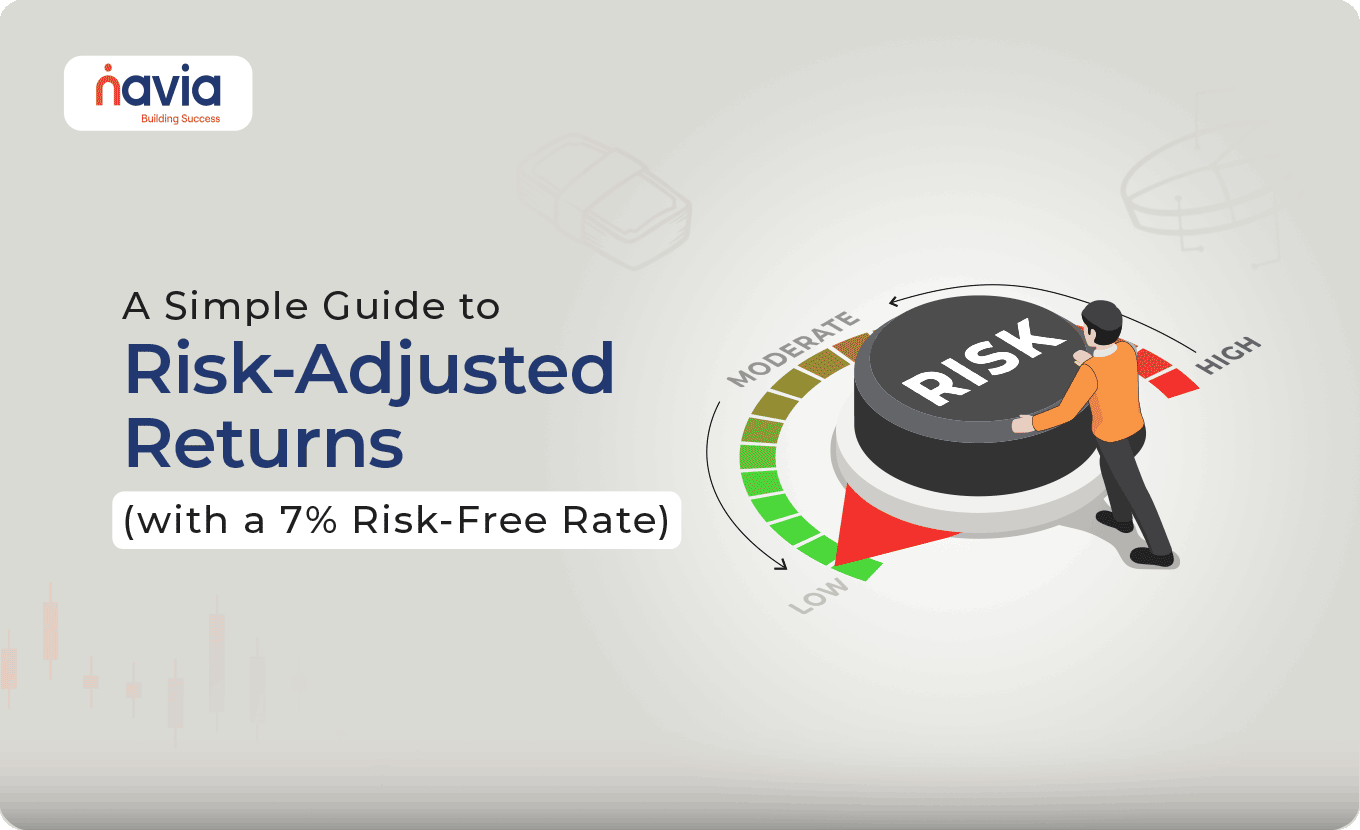
Return is Easy, But What About Risk? A Simple Guide to Risk-Adjusted Returns (with a 7% Risk-Free Rate)
💡 Quick Answer
A risk-adjusted return shows how much return an investment produced for each unit of risk taken. Risk is the volatility of returns, measured by standard deviation. The Sharpe Ratio is return minus the risk-free rate, divided by standard deviation — a higher ratio means more return per unit of risk.
What is Risk in Investing?
Risk is the volatility or uncertainty in your investment’s returns. Even if two stocks give the same average return, one might be much bumpier than the other. The bumpier one is riskier.
We use Standard Deviation to measure how much returns fluctuate. The more it jumps around, the higher the risk.
Example: Stock A vs Stock B (with Risk-Free Rate = 7%)
| Investments | Avg Annual Returns | Std. Dev (Risk) | Sharpe Ratio |
| Stock A | 12% | 10% | (12%-7%) ÷ 10% = 0.50 |
| Stock B | 15% | 20% | (15%-7%) ÷ 20% = 0.40 |
Even though Stock B gave a higher return, Stock A is more efficient — it generated more return per unit of risk.
Mutual Fund Comparison (Risk-Free Rate = 7%)
The same test applied to two mutual funds shows why the higher headline CAGR does not automatically win:
| Mutual Funds | 5Y CAGR | Std Dev | Sharpe Ratio |
| Fund X | 10% | 8% | (10%-7%) ÷ 8% = 0.375 |
| Fund Y | 12% | 15% | (12%-7%) ÷ 15% = 0.33 |
Fund X might be more “boring,” but it’s better adjusted for risk. Cost is the other quiet drag on the same comparison — see direct vs regular mutual funds for what the expense ratio does to the return side of this ratio.
Options Vs ETFs (Using Sharpe with 7% Risk-Free)
Let’s say:
- Nifty ETF gives a 10% return, risk (std dev) 7%
- Nifty Call Option gives a 30% return, risk (std dev) 35%
| Investments | Returns | Std Dev | Sharpe Ratio |
| Nifty ETF | 10% | 7% | (10%-7%) ÷ 7% = 0.43 |
| Nifty Option | 30% | 35% | (30%-7%) ÷ 35% = 0.66 |
This time, the option appears better on a risk-adjusted basis — but it comes with higher capital loss risk and requires skill. That’s why Sharpe ratio must be interpreted carefully, especially in derivatives.

Why Risk-Adjusted Return Matters?
Risk-adjusted return matters because two investments with similar returns can put you through very different journeys to get there. Imagine these two funds:
- Fund A: 15% return with low volatility → more peace of mind
- Fund B: 17% return with wild swings → stressful and riskier
Sharpe Ratio helps you pick quality over flash — consistent, predictable performers over wild returns. If steadiness is what you are after in the first place, fixed income mutual funds sit at the low-volatility end of this spectrum.
Sharpe Ratio Formula Refresher

In our examples, we used 7% as the risk-free rate — similar to an Indian 1-year FD.
The Sharpe Ratio answers how much risk sat behind a return. A separate question is how to measure the return itself when you invested in instalments rather than in one go — that is what XIRR in mutual funds is for.
Bottom Line
- A high return means little unless you know how much risk was taken to earn it
- Use Sharpe Ratio to compare investments more meaningfully
- Look at this metric for mutual funds, stocks, and even derivatives
Key Takeaways
- Risk in investing is the volatility or uncertainty of returns, and it is measured by standard deviation.
- The Sharpe Ratio is return minus the risk-free rate, divided by standard deviation — it converts a raw return into a return per unit of risk.
- Every worked example here uses 7% as the risk-free rate, similar to an Indian 1-year FD.
- A higher headline return can still be the worse choice: Stock B at 15% scores 0.40 against Stock A at 12% scoring 0.50.
- The same holds for funds — Fund X at 10% scores 0.375 against Fund Y at 12% scoring 0.33.
- In derivatives the ratio needs care: the Nifty option scores higher at 0.66, but carries greater capital loss risk and requires skill.
Did you find this article helpful?
Your feedback helps us write better content.

DISCLAIMER: Investments in the securities market are subject to market risks, read all the related documents carefully before investing. The securities quoted are exemplary and are not recommendatory. Brokerage will not exceed the SEBI prescribed limit. Full disclaimer: https://bit.ly/naviadisclaimer.