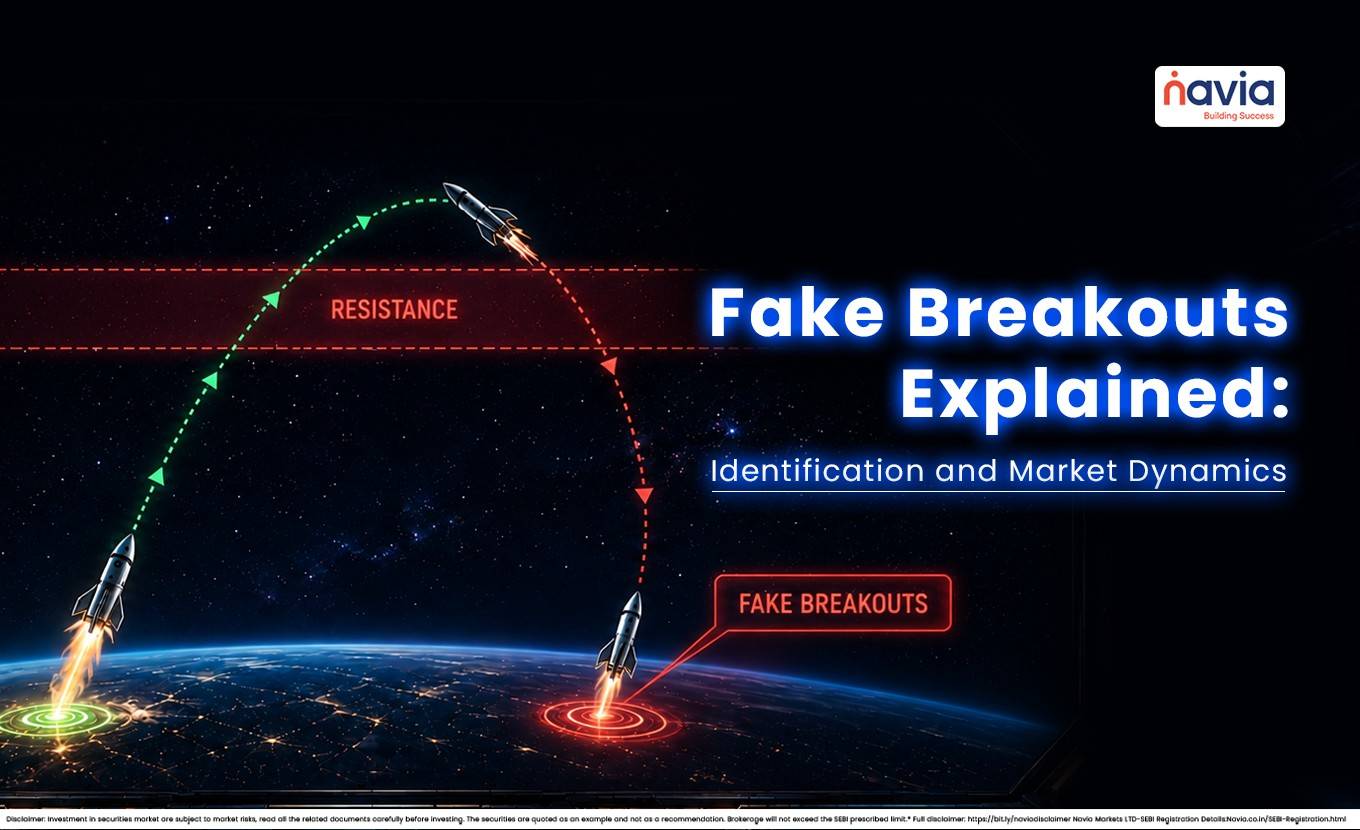
Fake Breakouts Explained: Identification and Market Dynamics
- What is a Fake Breakout?
- How to Identify a Fake Breakout?
- Fake Breakout Patterns — What They Look Like on the Chart
- How to Avoid Fake Breakout Mistakes — 6 Errors and Their Fixes
- Conclusion
- Frequently Asked Questions
A fake breakout happens when price moves beyond a support or resistance level, tempts traders to enter, and then quickly reverses back inside the range. For options traders, this kind of move can be studied as part of market behaviour analysis if the setup is handled with patience, confirmation, and risk control.
This topic matters because a breakout that fails often moves sharply in the opposite direction, which may be observed by market participants. In this blog, we will cover what is fake breakout in trading, how to identify fake breakout, how to avoid fake breakout, and how to trade fake breakout in a way that stays engaging and practical.
What is a Fake Breakout?
A fake breakout (also called a false breakout, bull trap, or bear trap) happens when price briefly crosses a key level, attracts traders who enter expecting a continuation, and then reverses -leaving those traders trapped in a losing position. That trapped-trader exit creates additional momentum in the reversal direction.
Fake Breakout = Price moves beyond Support/Resistance + Fails to SUSTAIN + Reverses sharply
Why Fake Breakouts Happen?
🔹 Stop-loss hunting: Large participants push price through key levels to trigger stop-loss of retail traders positioned at those levels. The resulting flush provides liquidity to open positions at better prices.
🔹 Low-conviction breakouts: Price breaks a level on thin volume or without institutional participation — the move runs out of fuel and reverses.
🔹 Options wall effect: Heavy open interest at a strike creates resistance as option market makers hedge their short gamma exposure by selling futures. This ‘pinning’ creates repeated failed breakout attempts.
🔹 Event relief spikes: News creates a sharp move that the underlying trend does not support. Post-FOMC, post-RBI spikes that quickly reverse are classic event-driven fake breakouts.
How to Identify a Fake Breakout?
Most fake breakouts share a cluster of signals. No single signal is sufficient — the more that align, the higher the probability, the breakout is false.
| Signal | What to Look For | Commonly Observed Characteristics | Alternative Market Behavior |
|---|---|---|---|
| Rejection Candle | Long wick above resistance (or below support) with close back inside range | Wick >2x body size; body closes clearly inside range | Small wick; strong close outside —may be real breakout |
| Volume Fade | Volume on breakout candle is lower than average, or drops sharply on next candle | Breakout volume < 70% of 20-day avg; next candle volume falls | Volume expands on breakout — signals institutional participation |
| Speed of Reversal | Price snaps back within 1–2 candles after the breakout | Returns inside range within the same 15-min or next candle | Takes 4–5 candles to drift back — indecision, not fake |
| Delta / OI Divergence | Option call writers not covering after breakout — large OI at resistance stays | OI at 24,000 CE remains high despite price break above | OI at resistance falls sharply — call writers panic = real breakout |
| Multiple Retests Fail | Price has tested the same level 3+ times without closing above | 3+ failed attempts at 24,000 — each creates a fake breakout candidate | First-time test of a level — higher chance of a clean breakout |
| India VIX Spike on Breakout | IV spike on the breakout candle often means uncertainty, not conviction | VIX jumps 5%+ on breakout candle — fear-driven, likely to reverse | VIX stable or declining on breakout — calm conviction |

Fake Breakout Patterns — What They Look Like on the Chart
| Pattern | Description | Candle Signature | Live Nifty Example (June 2026) |
|---|---|---|---|
| Bull Trap (Failed Upside Breakout) | Price breaks above resistance, traps longs, reverses sharply below | Long upper wick; bearish engulfing on next candle; closes below resistance | Nifty touched 24,047 on Jun 16 but slipped to close at 23,995 — classic rejection at 24,000 |
| Bear Trap (Failed Downside Breakdown) | Price breaks below support, traps shorts, reverses sharply above | Long lower wick; bullish engulfing; closes above support | Nifty hit 23,072 on Jun 11 (intraday low) then recovered 255 pts to close at 23,161 — trapped short-sellers |
| Evening Star Fake Breakout | 3-candle pattern: bullish candle, doji above resistance, bearish reversal | Doji or spinning top at breakout level; bearish candle closes back inside | Common at 24,000–24,047 zone in Jun 2026 as price coils at resistance |
| Wick Rejection | Single candle breaks level but closes back — most common intraday fake | Long wick (>2x body) that pierces resistance/support; body stays inside | Jun 16 intraday: Nifty wick to 24,047 then pulled back to close at ~23,996 |
| Volatility Squeeze Fake | After tight range, price pops’ on low-conviction, reverses | Narrow-range candle breaks out, immediate next candle reverses on higher volume | NR21 compression noted on Jun 16, 2026 — coiled for expansion but daily close showed rejection |
How to Avoid Fake Breakout Mistakes — 6 Errors and Their Fixes
| Mistake | Why Traders Make It | Cost | How to Avoid It |
|---|---|---|---|
| Entering on the breakout candle (first move) | FOMO — fear of missing the move | Buys the very top of the fake move; maximum loss position | Always wait for 15-min close confirmation. First candle is bait. |
| Trading without Volume confirmation | Volume not visible on most simple setups | Enters fake setup that turns real — no edge, just a bet | Check volume vs 20-day average on the breakout candle before entry |
| Using market orders on entry | Excitement / urgency | Pays wide bid-ask on a potentially fast-moving option | Use limit orders. The reversal gives you time — it is not a sprint. |
| Setting stop too close to entry | Fear of large loss | Stops out on normal intraday noise before the real move begins | Stop must be above/below the wick high/low of the fake candle, not entry |
| Trading during event windows (RBI/FOMC) | Events create sharp moves that look like fake breakouts but aren’t | Event-driven gaps can reverse stop-limit orders and cause double whipsaw | Reduce size or avoid directional options during first 30 min post-event |
| Holding too long after target is reached | Greed — hoping for more | Give back gains as theta accelerates and reversal loses momentum | Pre-define target at next support/resistance. Exit at target, no negotiation. |
The chart examples and market references used in this article are provided solely for educational purposes and should not be interpreted as trading signals, strategy recommendations, or forecasts of future market behavior.
Conclusion
A fake breakout is not just a chart trick; it is a market behavior that can create opportunity when read carefully. If you understand what is fake breakout in trading, learn how to identify fake breakout, and stay patient enough to how to avoid fake breakout, you can approach these setups with more confidence.
The most important habit is to wait for confirmation before taking the opposite side. When used carefully, how to trade fake breakout becomes less about guessing and more about reading rejection, timing the reversal, and keeping risk under control.
Do You Find This Interesting?
We’d Love to Hear from you-

Frequently Asked Questions
What exactly is a fake breakout?
A false move where price briefly crosses a support or resistance level but quickly reverses back inside the range — trapping traders who entered on the initial breakout.
Why some traders monitor these patterns for educational purposes instead of selling a call?
Buying puts gives defined risk — maximum loss is the premium paid. Selling calls has unlimited risk if the breakout turns real. For fake breakout trades, the defined-risk approach (buying the opposite option) is more disciplined.
How long should I hold the put after a fake breakout?
Typically 1–3 sessions. Theta decay accelerates after that. If Nifty has not moved to your target within 3 sessions, reassess the setup rather than holding on hope.
What is the difference between a fake breakout and a pullback?
A fake breakout never truly breaks the level — it wicks through briefly and reverses. A pullback is a real breakout followed by a retracement that holds above (or below) the broken level before continuing.
DISCLAIMER: Investment in securities market are subject to market risks, read all the related documents carefully before investing. The securities quoted are exemplary and are not recommendatory. Full disclaimer: https://bit.ly/naviadisclaimer.