Navia Weekly Roundup (May 04 – 08, 2026)
- Week in the Review
- Indices Analysis
- Interactive Zone!
- Sector Spotlight
- Top Gainers and Losers
- Currency Chronicles
- Commodity Corner
- Top Blogs of the Week!
- N Coins Rewards
Week in the Review
The Indian benchmark indices ended higher in the volatile week ended May 8 despite global uncertainties, rising crude oil prices, and persistent selling by Foreign Institutional Investors (FIIs). However, sustained buying by Domestic Institutional Investors (DIIs), appreciation in the rupee, and better-than-expected domestic corporate earnings provided support to market activity.
Indices Analysis
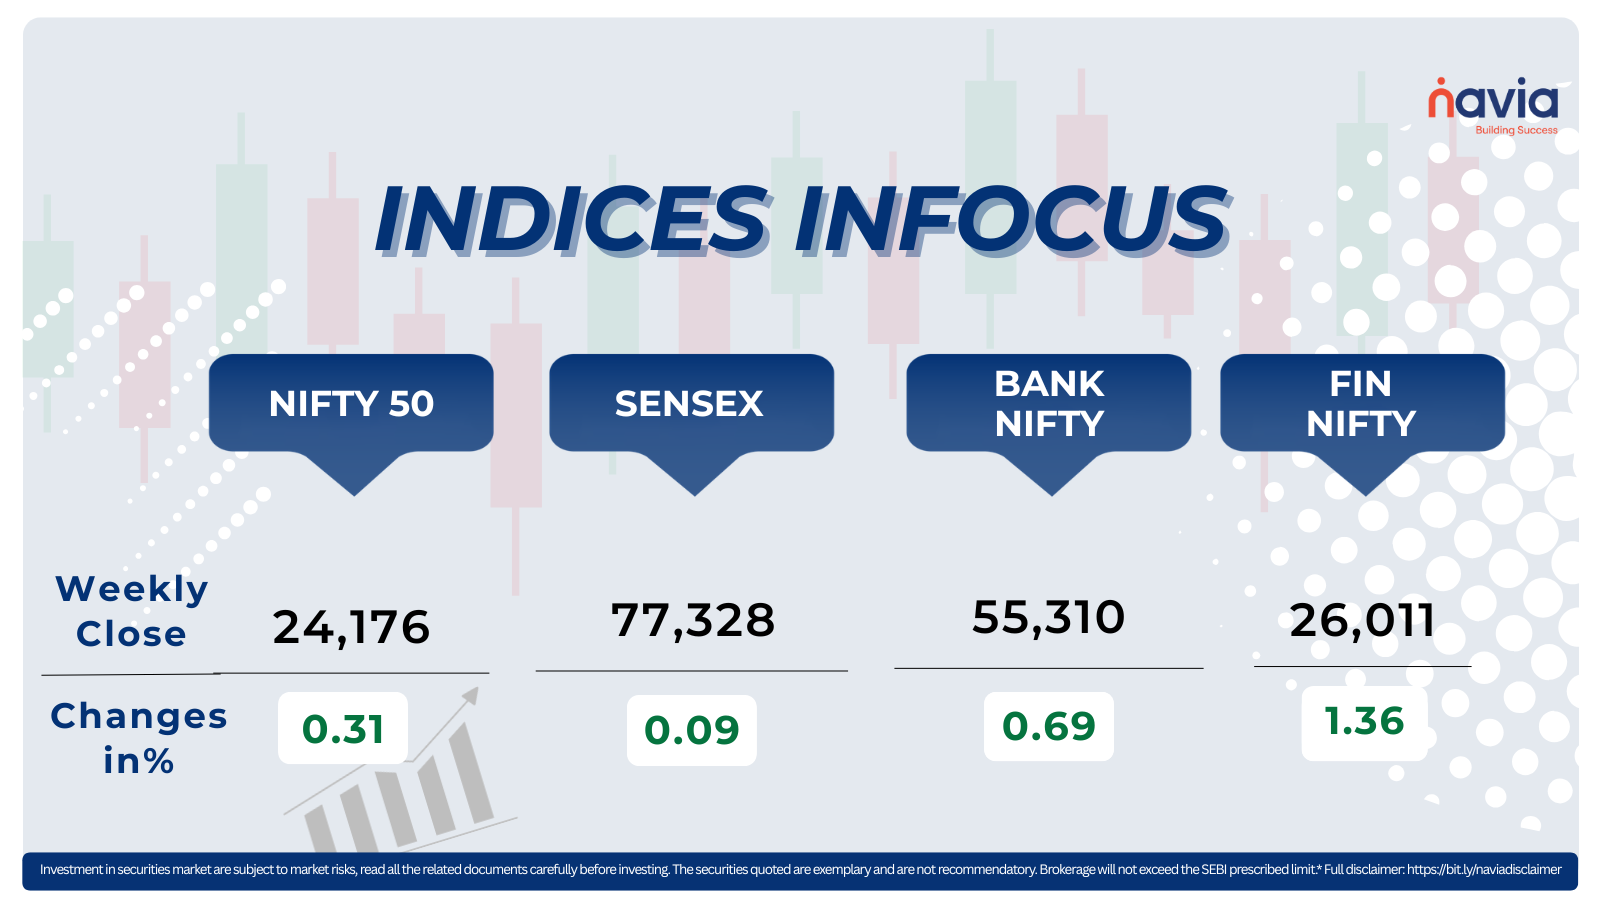
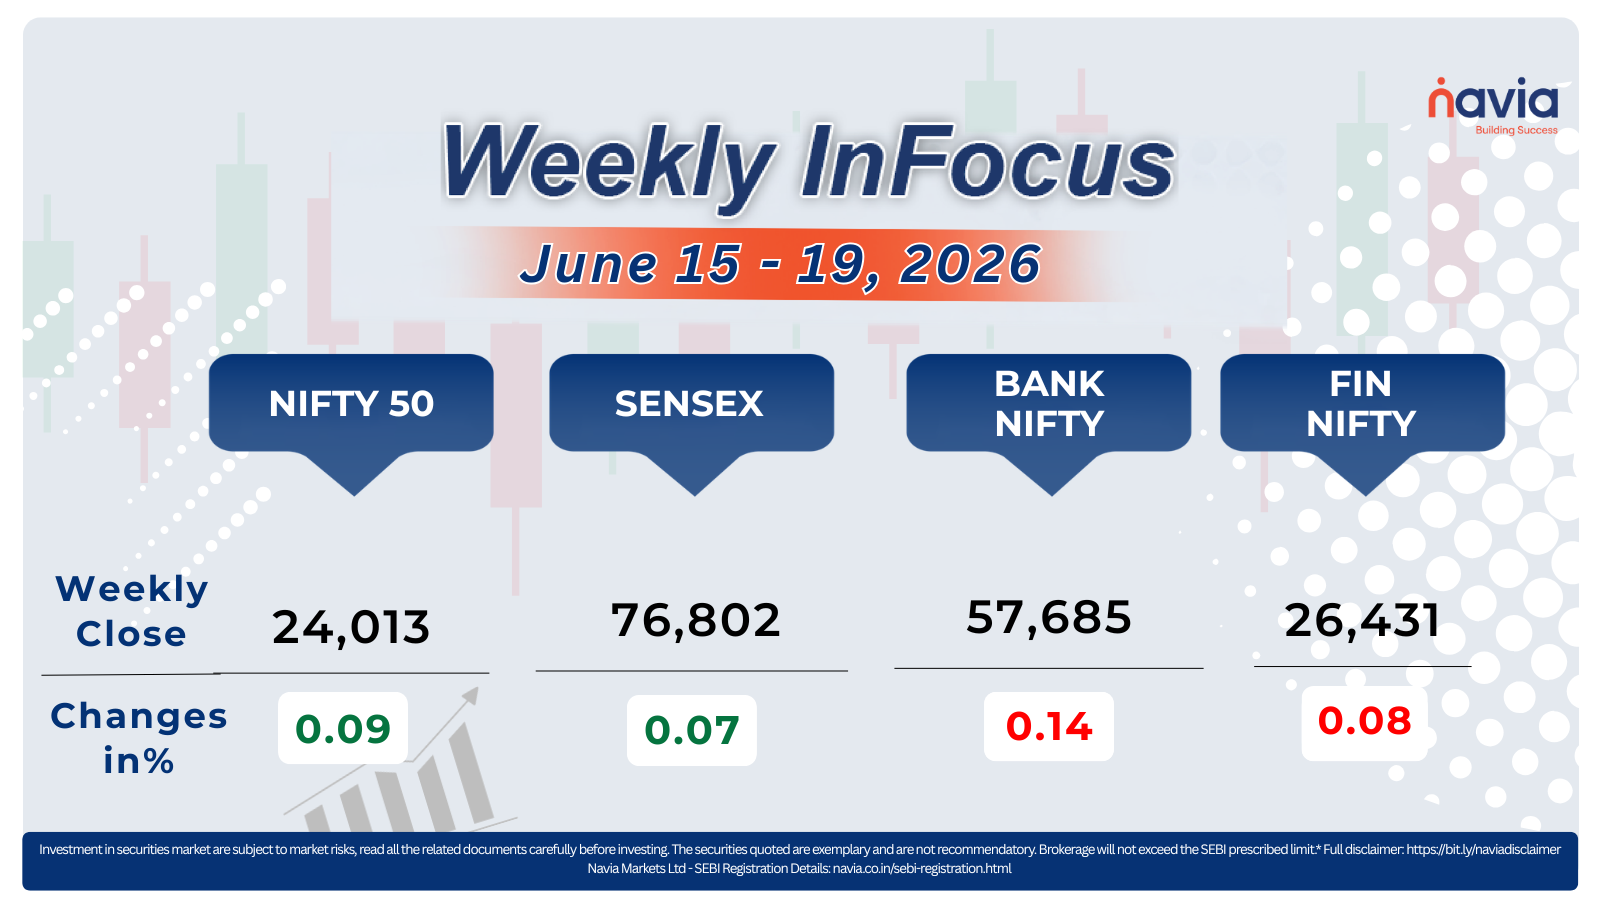
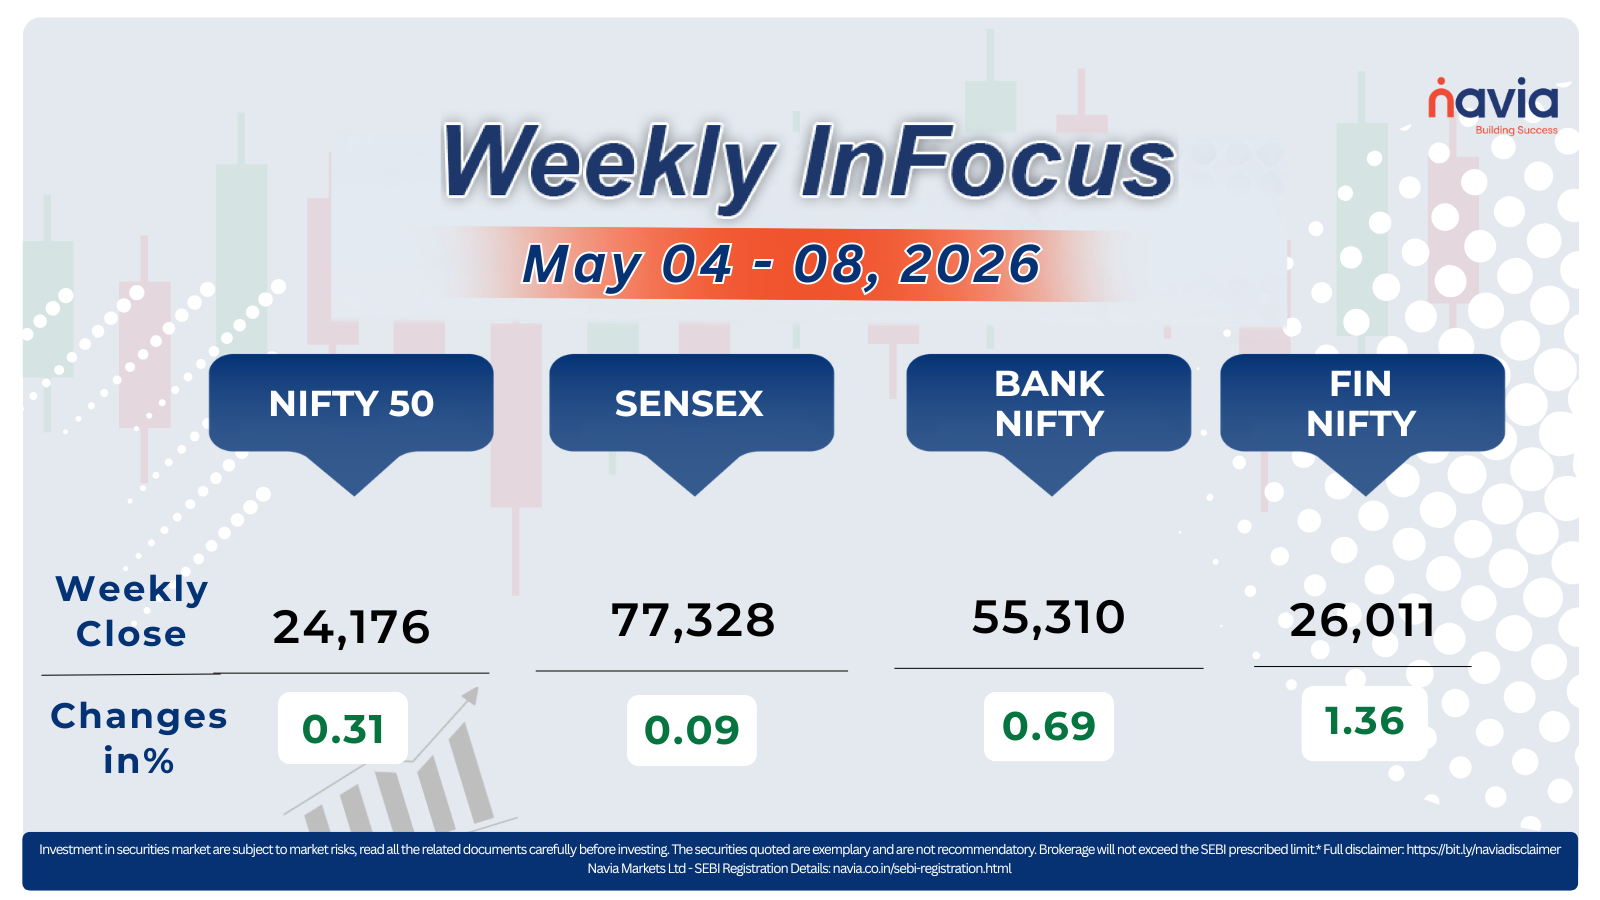
For the week, the BSE Sensex advanced 0.09%, to close at 77,328.19, while the Nifty 50 gained 0.31%, to settle at 24,176.15.
The total market capitalisation of BSE-listed companies increased by more than ₹10 lakh crore during the week. Among the gainers, Mahindra and Mahindra recorded higher market capitalisation growth, followed by Adani Ports and Special Economic Zone, HDFC Bank, Asian Paints. In contrast, State Bank of India, Bharti Airtel, Tata Consultancy Services witnessed a decline in their market capitalisation during the same period.
The Nifty Smallcap index gained 4% during the week, recording gains for the fifth consecutive week. Among the major gainers were Firstsource Solutions, Nuvama Wealth Management, Dr Lal PathLabs, Neuland Laboratories, Anant Raj, CreditAccess Grameen, and Wockhardt, which rose between 15% and 28%. On the other hand, Urban Company, Gujarat Mineral Development Corporation (GMDC), Devyani International, Sona BLW Precision Forgings, Aarti Industries, and Brigade Enterprises were among the major decliners during the week.
The Nifty Midcap 100 index advanced 3.5% during the week, extending gains for the second consecutive week and reaching a new high level. The gains were observed in stocks such as Yes Bank, Bharat Heavy Electricals (BHEL), Coforge, Polycab India, Laurus Labs, Dabur India, SRF, and Motilal Oswal Financial Services. On the downside, Oil India, Voltas, LG Electronics India, Lenskart Solutions, Blue Star, and Billionbrains Garage Ventures were among the key laggards during the week.
The Indian rupee touched a fresh all-time low of 95.43 during the week but recovered during the week to end higher, ending three consecutive weeks of decline. On Friday, the rupee settled 44 paise stronger at 94.48 against the U.S. dollar, compared to 94.92 in the previous week.
Interactive Zone!
Test your knowledge with our Markets Quiz! React to the options and see how your answer stacks up against others. Ready to take a guess?
Sector Spotlight
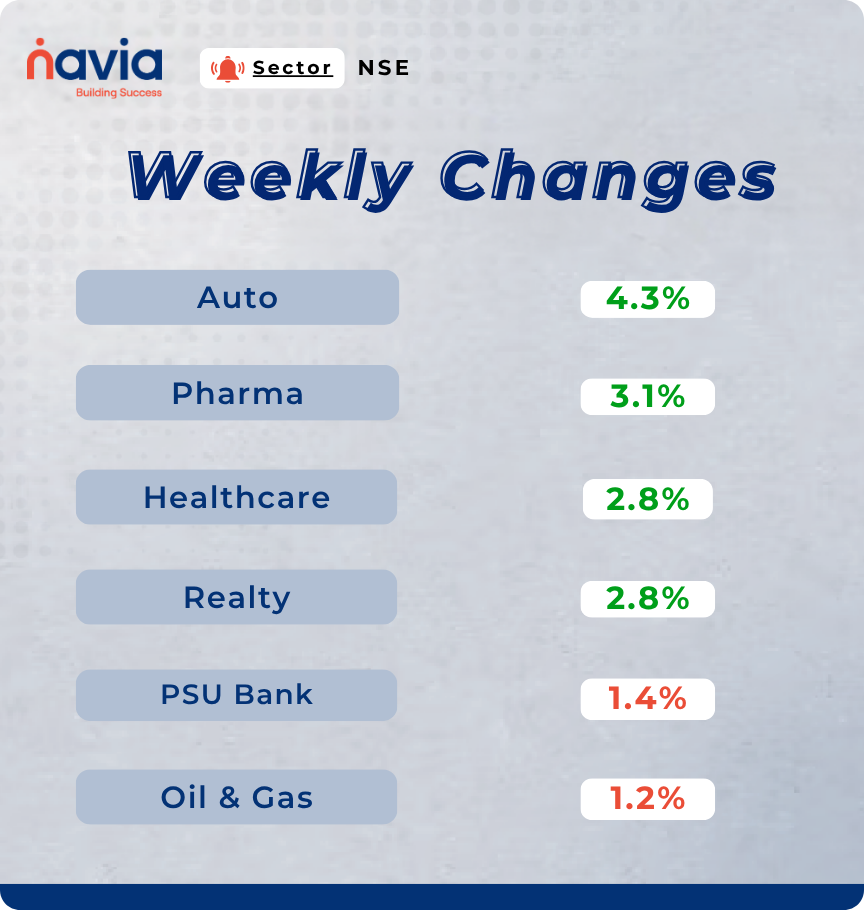
During the week, Indian markets exhibited a mixed sectoral trend. Notable gainers included the Nifty Auto index, which rose 4.3%, followed by Nifty Pharma at 3.1%, Nifty Healthcare at 2.8%, and Nifty Realty at 2.8%. In contrast, the Nifty PSU Bank index emerged as the largest decline, declining 1.4%, while Nifty Oil & Gas was down 1.2%.
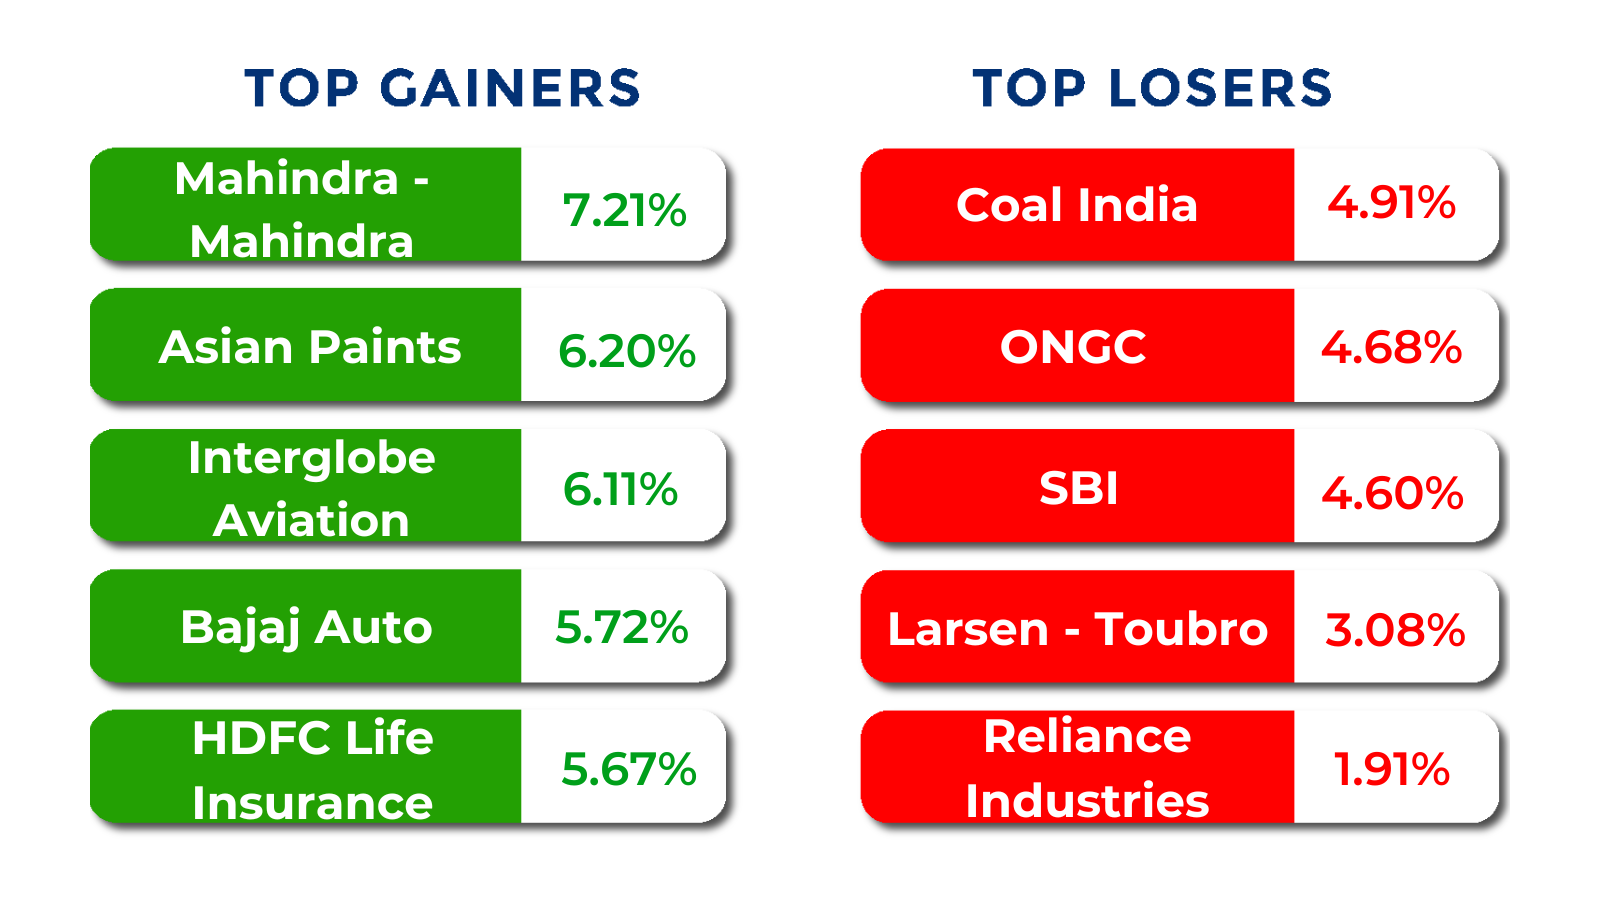
Top Gainers and Losers
Currency Chronicles
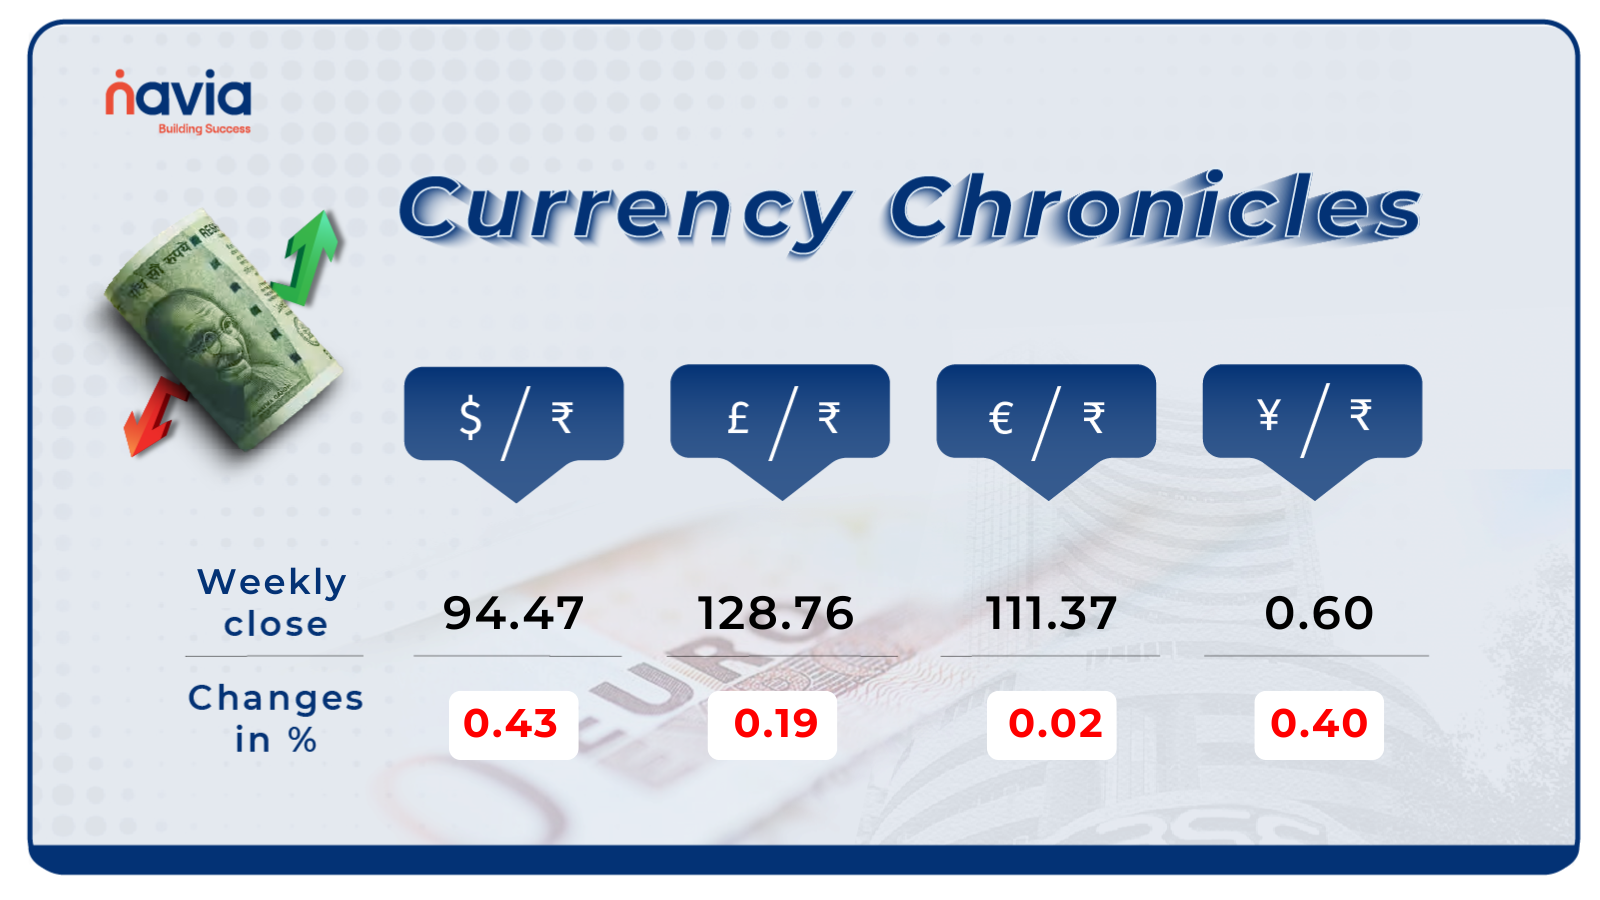
USD/INR:
The USD/INR rate closed at ₹94.47 per dollar, losing 0.43% during the week, reflecting a bearish market sentiment.
EUR/INR:
The EUR/INR rate closed at ₹111.37 per euro, losing 0.02% during the week, reflecting a bearish market sentiment.
JPY/INR:
The JPY/INR rate closed at ₹0.60 per yen, losing 0.40% during the week, reflecting a bearish market sentiment.
Stay tuned for more currency insights next week!
Commodity Corner
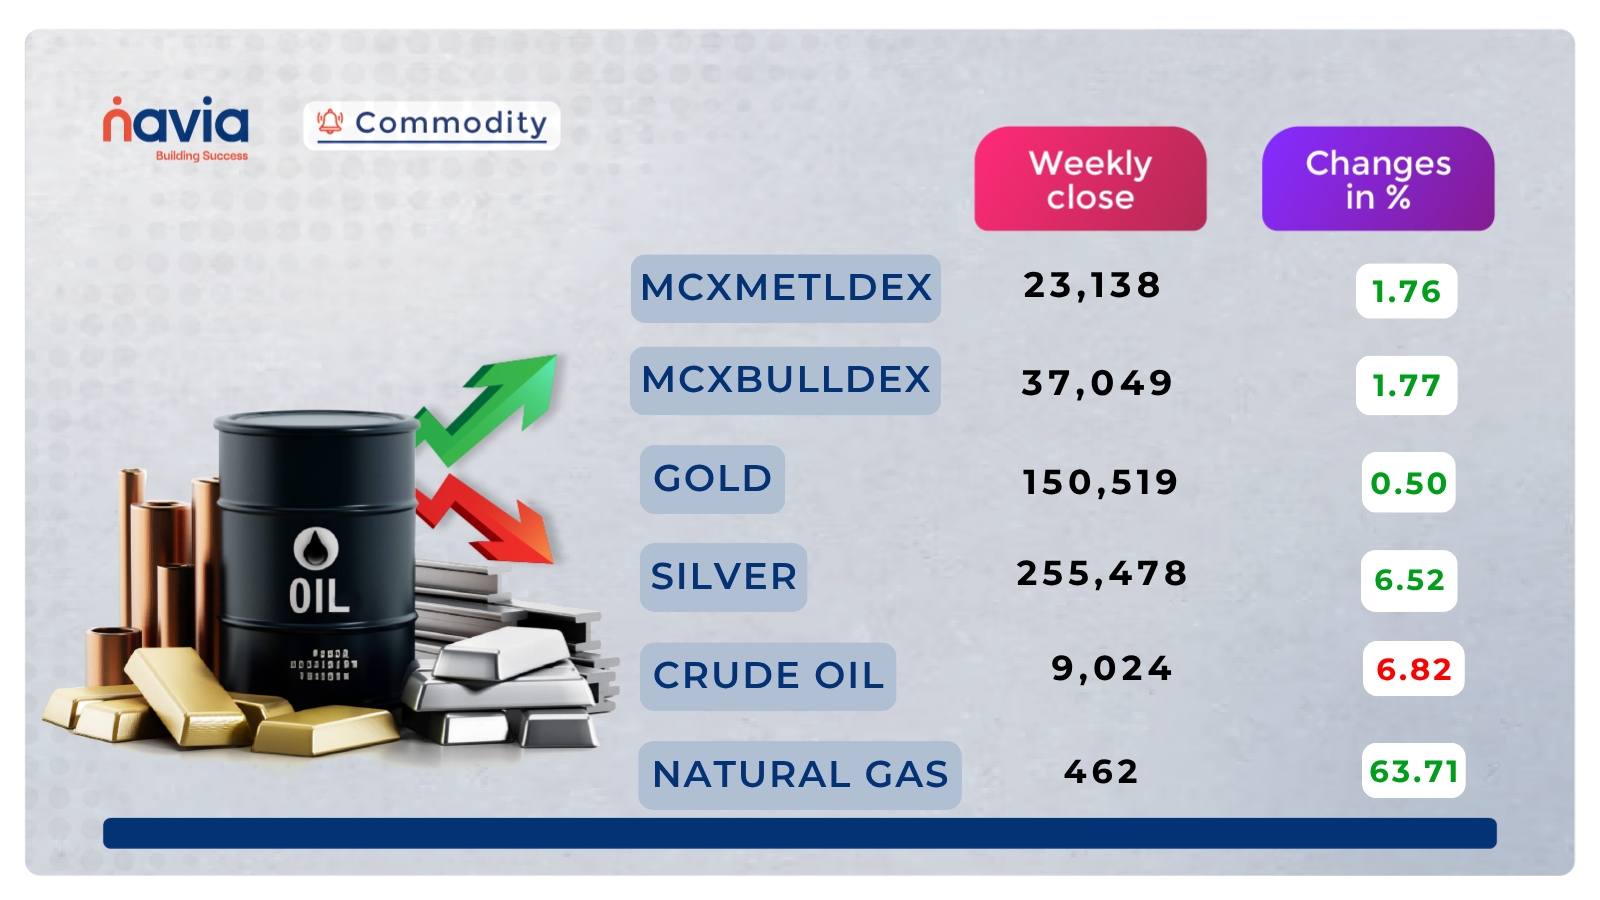
Crude Oil futures are showing a green candle formation building on yesterday’s recovery from the sharp corrective lows near 8,676. The price has bounced meaningfully from the lower demand zone and is now approaching the immediate overhead resistance band near 9,210, with early buying activity observed and the broader corrective phase showing reduced selling momentum following the aggressive multi-session decline from the highs above 10,400.
The broader structure shows signs of consolidation near the current demand zone, with the price finding support observed following the sharp markdown and dip buyers beginning to reassert presence near key structural levels. The current zone near 9,050–9,150 reflects early recovery momentum and increased buying activity. A sustained trade above 9,210 may indicate continuation of recovery and may lead to upward movement toward 9,260 and 9,310, extending the bounce from the corrective low.
On the downside, immediate support lies near 8,850, followed by stronger structural demand near 8,675. A breakdown below 8,850 would delay the recovery and re-expose lower support levels, though the near-term price remains above the identified support zone as long as price holds above the key demand zone.
Gold futures are showing a steady green candle building on the prior session’s recovery as the price continues to hold above the ascending trendline support. The broader recovery structure from the corrective lows near 148,500 remains intact, with buyer participation strengthening across sessions and the price gradually working its way toward the key overhead resistance band near 153,500–155,000.
The broader structure remains showing upward movement, with the price sustaining above the key 152,000 support zone and the ascending trendline continuing to provide dynamic demand support on dips. The current zone near 152,500–153,000 reflects buying activity observed and improving momentum ahead of a possible movement above resistance. A decisive breakout and sustained close above 153,500 would confirm the continuation of the bullish recovery and invite upside momentum toward 155,000 and 156,500, indicating continuation of recovery from the corrective lows.
On the downside, immediate support lies near 152,000, followed by stronger structural demand near 150,500. A breakdown below 152,000 would delay the recovery and invite a corrective retracement, though the price remains above the identified support zone on dips as long as price holds above the key structural support zone.
Natural Gas futures are showing mild positive momentum with a small green candle holding above the key structural support zone near 260 following the multi-session pullback from the recent highs near 275. The price has been gradually building a base above the 260 demand level and continues to attract buying activity at lower levels, with the broader recovery structure from the multi-week lows near 237 remaining intact and the near-term bias favouring the upside on dips.
The broader structure continues to favour buyers, with the price sustaining above the key 260 structural support and the recovery from lower levels remaining the broader movement trend. The current consolidation near 263–265 reflects orderly digestion within the broader recovery trend, with buyers defending pullbacks and price remains above support levels. A sustained trade above 265.5 would confirm continued upward movement and invite upside toward 267.5 and 269.5.
On the downside, immediate support lies near 260, followed by stronger demand near 258.5. A breakdown below 260 would delay the recovery and signal a deeper corrective phase, though the price remains above the identified support zone on dips as long as price holds above the key 260 demand zone.
Silver Futures are showing strong upward movement with a prominent green candle breaking above the 260,000 level and approaching the immediate overhead resistance band near 263,000. The price has staged a decisive and broad-based advance from the recent corrective lows near 235,000, with the ascending trendline providing strong dynamic support and continued buying activity observed across recent sessions.
The broader structure remains maintaining upward movement, with the price printing consistent higher highs and higher lows from the corrective base and the ascending trendline continuing to underpin the dominant recovery trend. The current zone near 259,000–261,000 reflects buying activity observed and continued upward movement as price approaches key overhead resistance. A decisive breakout and sustained close above 263,000 would may indicate continuation of upward movement and invite upside momentum toward 265,000 and 267,000, extending the rally toward the prior highs.
On the downside, immediate support lies near 257,000, followed by stronger structural demand near 254,500. A breakdown below 257,000 would invite short-term corrective pressure, though the prevailing bullish structure price remains above support levels as long as price holds above key structural demand.
Do you have a question? Ask here and we’ll publish the information in the coming weeks.
Top Blogs of the Week!

MTF Interest Rates: How They Affect Your Trading Returns
In the world of the stock market, the Margin Trading Facility (MTF) is a widely used facility that allows you to increase market exposure using funded positions. However, this increased buying power comes with a cost: MTF interest rates.

Taxation on Bonds in India: Interest, Capital Gains, and Key Aspects to Understand
Bonds are commonly used for income-oriented investing, but to understand your real returns, you must factor in the taxman’s share. In India, bond taxation is split into two categories: the regular interest you receive and the profit you make if you sell the bond.
N Coins Rewards

Refer your Friends & Family and GET 500 N Coins.
Do You Find This Interesting?

DISCLAIMER: Investment in securities market are subject to market risks, read all the related documents carefully before investing. The securities quoted are exemplary and are not recommendatory. Full disclaimer: https://bit.ly/naviadisclaimer.