5 Simple Tools to Master Option Analysis Like a Pro!

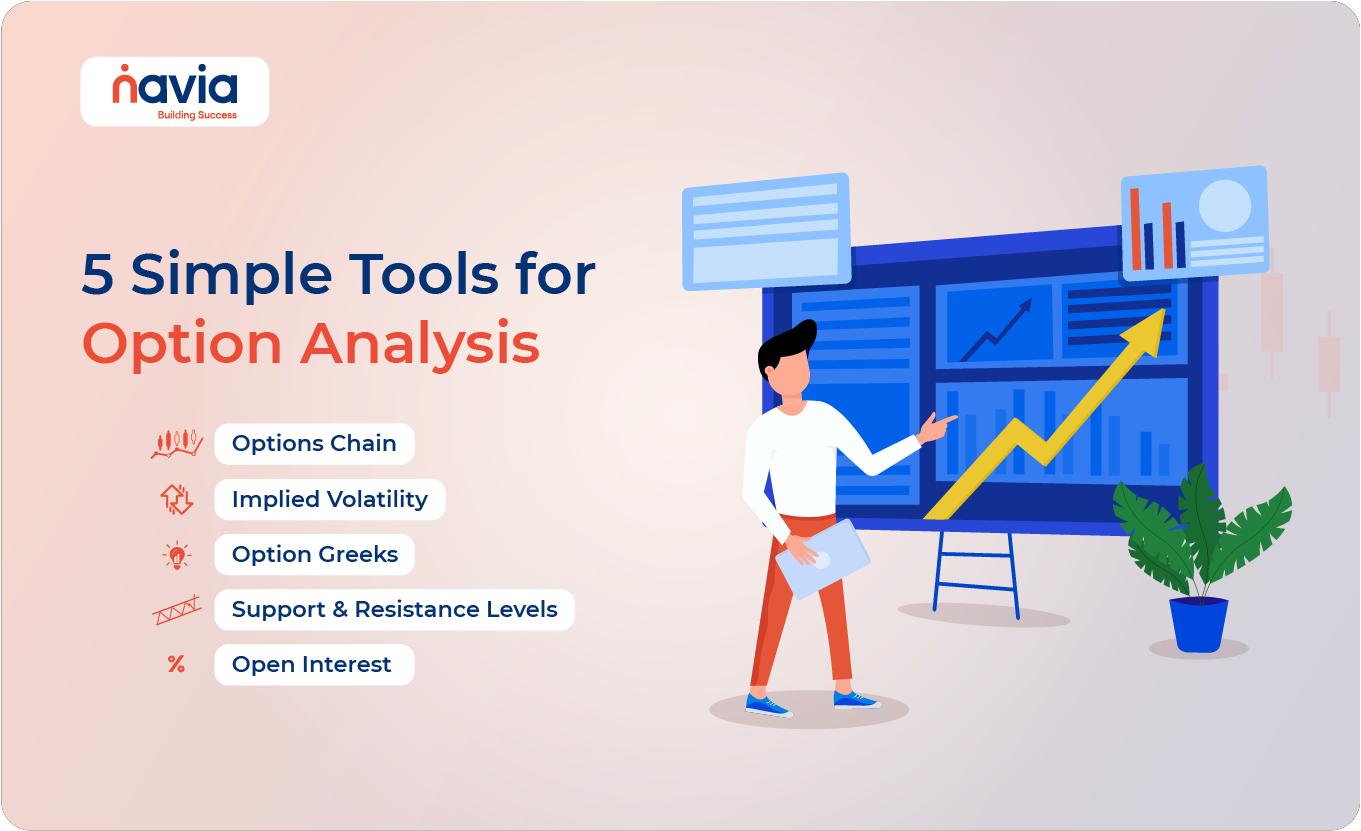
Options trading can be an exciting and profitable way to engage in the financial markets, but it can also be complex and challenging, especially for beginners. To succeed in options trading, it’s crucial to have the right tools at your disposal. In this blog, we’ll explore five simple yet powerful tools for option analysis that every trader should know. These tools will help you make more informed decisions, manage risk effectively, and ultimately increase your chances of success in the options market. We’ll also discuss how you can use the zero brokerage f&o trading app to enhance your option trading experience.
1. Options Chain
An options chain is a comprehensive list of all available options for a particular underlying asset, such as a stock or index. It displays various strike prices and expiration dates, along with the corresponding call and put option prices. The options chain is one of the most fundamental tools for options traders because it provides a snapshot of the current market sentiment and allows you to compare different options contracts.
How to Use an Options Chain
Let’s say you’re interested in trading options on a stock currently trading at ₹1,000. By looking at the options chain, you can see the available call and put options at various strike prices, such as ₹950, ₹1,000, and ₹1,050, with expiration dates ranging from a few days to several months.
For example, if you believe the stock price will rise to ₹1,050 in the next month, you might consider buying a call option with a strike price of ₹1,000 and an expiration date one month away. The options chain will show you the premium for this option, allowing you to assess whether it’s a good trade.
➝ Practical Tip: Use the options chain to compare the premiums of different strike prices and expiration dates. This will help you choose the option that best fits your market outlook and risk tolerance.
2. Implied Volatility (IV)
Implied Volatility (IV) is a measure of the market’s expectation of how much the price of the underlying asset will move in the future. IV is a critical component of options pricing, as it directly affects the premium you’ll pay or receive when trading options. High IV usually means higher premiums, as the market anticipates significant price movements, while low IV suggests lower premiums.
How to Use Implied Volatility
Imagine you’re considering buying a call option on a stock trading at ₹500. If the implied volatility is high, say 30%, the premium for the option will be more expensive because the market expects a big move in the stock price. Conversely, if the IV is low, say 10%, the premium will be cheaper, reflecting the market’s expectation of limited price movement.
➝ Practical Tip: Be cautious when buying options with high IV, as the premium is inflated. If the market’s expectation of volatility doesn’t materialize, the option’s value could decrease rapidly, even if the underlying asset’s price moves in your favor.
3. Option Greeks
Option Greeks are a set of metrics that help traders understand how different factors affect the price of an option. The most important Greeks are Delta, Gamma, Theta, Vega, and Rho. Each Greek provides insight into a specific aspect of the option’s risk and potential reward.
● Delta (Δ): Measures the sensitivity of the option’s price to changes in the price of the underlying asset. For example, if Delta is 0.5, the option’s price will increase by ₹0.50 for every ₹1 increase in the underlying asset’s price.
● Gamma (Γ): Measures the rate of change of Delta as the underlying asset’s price changes. High Gamma indicates that Delta will change rapidly with small price movements, making the option more sensitive.
● Theta (Θ): Represents the time decay of an option. Theta indicates how much the option’s price will decrease each day as it approaches expiration. For example, if Theta is -₹0.02, the option’s price will decrease by ₹0.02 each day, all else being equal.
● Vega (ν): Measures the sensitivity of the option’s price to changes in implied volatility. If Vega is ₹0.10, the option’s price will increase by ₹0.10 for every 1% increase in implied volatility.
● Rho (ρ): Measures the sensitivity of the option’s price to changes in interest rates. Rho is less commonly used but can be important in certain market conditions.
➝ Practical Tip: Use the Greeks to analyze the risk and potential reward of your options trades. For example, if you’re concerned about time decay, look at Theta to understand how much value your option will lose each day.
4. Support and Resistance Levels
Support and resistance levels are critical technical analysis tools that help traders identify potential price points where the underlying asset might experience buying or selling pressure. Support is a price level where a stock or asset tends to find buying interest, preventing it from falling further. Resistance is a price level where selling pressure is likely to emerge, preventing the price from rising further.
How to Use Support and Resistance Levels
Suppose a stock is currently trading at ₹1,000 and has strong support at ₹950 and resistance at ₹1,050. If you believe the stock will bounce off the support level and rise towards resistance, you might consider buying a call option with a strike price near ₹950.
Conversely, if the stock is near resistance and you expect it to decline, you might consider buying a put option with a strike price near ₹1,050.
➝ Practical Tip: Use support and resistance levels to time your entry and exit points when trading options. This can help you increase your chances of success by aligning your trades with key price levels.
5. Open Interest (OI)
Open Interest (OI) refers to the total number of outstanding options contracts (both calls and puts) that are currently active in the market. OI is a useful indicator of market sentiment and liquidity. High OI suggests that there is significant interest in a particular option, which can indicate strong market sentiment and provide better liquidity for trading.
How to Use Open Interest
Let’s say you’re considering buying a call option on a stock trading at ₹750. You notice that the open interest for the ₹800 strike price call option is significantly higher than other strike prices. This indicates that many traders are interested in this particular strike price, suggesting that the market expects the stock to rise towards ₹800.
➝ Practical Tip: Use OI to gauge market sentiment and liquidity. Higher OI means better liquidity, which can lead to tighter bid-ask spreads and easier execution of your trades.

How to Use Navia Mobile App for Better Option Trading
The Navia Mobile App is a powerful tool that can enhance your option analysis by providing easy access to these essential tools for option analysis. Here’s how you can use the app to improve your trading decisions:
🔸 Options Chain: Use the Navia Mobile App to view the options chain for your desired underlying asset. The app allows you to compare different strike prices and expiration dates, helping you choose the best option for your strategy.
🔸 Implied Volatility: The app provides real-time data on implied volatility, allowing you to assess whether an option is overpriced or underpriced. This can help you avoid overpaying for options with inflated premiums.
🔸 Option Greeks: The Navia Mobile App displays the Greeks for each option, helping you understand the potential risks and rewards of your trades. You can monitor Delta, Gamma, Theta, Vega, and Rho in real-time, allowing you to make informed decisions.
🔸 Support and Resistance Levels: The app’s charting tools allow you to plot support and resistance levels for your underlying asset. This can help you time your entry and exit points more effectively.
🔸 Open Interest: The Navia Mobile App provides data on open interest, helping you gauge market sentiment and liquidity. This information can be invaluable when selecting the best options to trade.
Conclusion
Options trading can be a lucrative way to participate in the financial markets, but it requires the right tools and knowledge to succeed. By using these five simple tools—Options Chain, Implied Volatility, Option Greeks, Support and Resistance Levels, and Open Interest—you can enhance your option analysis and make more informed trading decisions.
The Navia Mobile App provides easy access to these tools, allowing you to monitor the market in real-time and adjust your strategies as needed. Whether you’re a beginner or an experienced trader, leveraging these tools can help you navigate the complexities of options trading and increase your chances of success. Happy trading!
DISCLAIMER: Investments in the securities market are subject to market risks, read all the related documents carefully before investing. The securities quoted are exemplary and are not recommendatory. Brokerage will not exceed the SEBI prescribed limit.
We’d Love to hear from you


