What is a Pennant Pattern in Stock Market Trading?
- How does the Pattern Form?
- Bullish & Bearish Pennant Patterns
- Pennant Vs Flag Pattern
- How do Traders Use it?
- Why it Matters?
- Conclusion
- Frequently Asked Questions
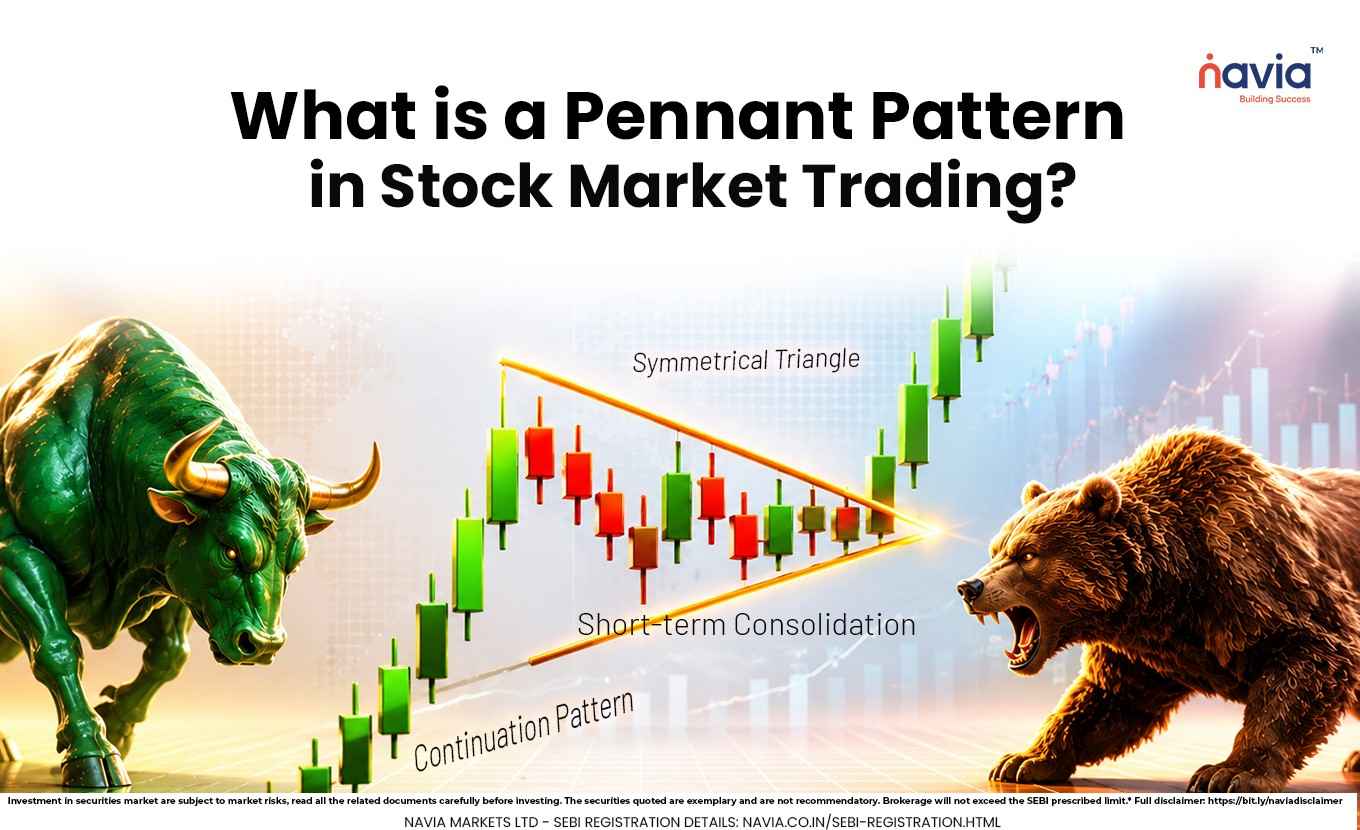
A pennant pattern is a short-term continuation pattern that appears after a strong price move and a brief pause in the chart. For traders searching for what is a pennant pattern, the simplest answer is that it shows a market taking a quick breath and may indicate continuation in the same direction.
This pattern is popular in pennant pattern technical analysis because it is used to identify momentum pauses, breakout zones, and possible trend continuation. The blog will help the readers who seek an explanation about the pattern without making profit claims or promises.
How does the Pattern Form?
A pennant pattern usually begins with a sharp move called the flagpole, followed by a small consolidation that forms two converging trendlines. The consolidation looks like a tiny triangle and is the part that gives the pattern its “pennant” shape.
In a pennant pattern chart, the price does not move freely in all directions. Instead, it tightens into a narrow range as buyers and sellers wait for the next move. This pause may reflect temporary indecision rather than a full reversal.
Bullish & Bearish Pennant Patterns
| Bullish Pennant Pattern | A bullish pennant pattern forms after a strong upward price move. After the rise, price consolidates inside a small triangle and may break to the upside if continuation occurs. This is why it is commonly interpreted as a bullish continuation setup rather than a reversal signal. |
| Bearish Pennant Pattern | A bear pennant pattern appears after a sharp downward move. The price then consolidates in a small triangle before breaking lower, which may indicate continuation of the downtrend. Just like the bullish version, the bearish setup is a continuation pattern, not a guaranteed signal. |
Pennant Vs Flag Pattern
People often confuse the flag pennant pattern with a flag pattern because both occur after strong price moves, and both are continuation patterns. The main difference is shape: a flag usually forms a parallel channel, while a pennant forms a converging triangle.
That difference matters in pennant pattern trading because the breakout behavior and chart structure help traders decide whether they are seeing a flag or a pennant. In practice, both patterns are used to study trend continuation, but the pennant narrowing shape is the key visual clue.

How do Traders Use it?
In pennant pattern trading, traders usually wait for the breakout after the consolidation ends. Traders typically observe whether price breaks above the triangle in a bullish setup or below it in a bearish setup.
Volume is often watched closely as well. A strong initial move followed by lighter volume during consolidation and renewed volume during breakout is often considered additional confirmation by some traders.
Why it Matters?
The pennant pattern is useful because it is used to interpret fast market moves. Instead of reacting to every candle, traders can wait for the pause, study the shape, and observe whether price confirms the next move.
It is also a simple pattern to explain to beginners. Since many readers search for pennant patterns, pennant pattern charts, and what is a pennant pattern, the topic will help them to easily understand the market movements.
Conclusion
A pennant pattern is a short-term chart of formation that usually appears after a sharp move and a brief consolidation. In pennant pattern technical analysis, it is studied as a continuation pattern that may indicate a pause in the trend before potential continuation.
Whether you are looking at a bullish pennant pattern, a bear pennant pattern, or comparing it with a flag pennant pattern, the key idea is the same: price moves strongly, pauses, and then may continue if the breakout is confirmed. For traders and readers alike, understanding what is a pennant pattern may support clearer chart interpretation.
Do You Find This Interesting?
We’d Love to Hear from you-

Frequently Asked Questions
What is a pennant pattern?
A pennant pattern is a short-term continuation pattern that forms after a strong price move and a brief consolidation.
Is a pennant pattern bullish or bearish?
It can be both. A bullish pennant appears after an uptrend, while a bearish pennant appears after a downtrend.
What does a pennant pattern chart look like?
It usually looks like a small triangle formed by converging trendlines after a sharp move in price.
How is a pennant different from a flag pattern?
A pennant has converging trendlines, while a flag usually forms a parallel channel.
Is pennant pattern trading reliable?
It can be useful, but no pattern is perfect. Traders often wait for breakout confirmation and use risk management.
DISCLAIMER: Investment in securities market are subject to market risks, read all the related documents carefully before investing. The securities quoted are exemplary and are not recommendatory. Full disclaimer: https://bit.ly/naviadisclaimer.