Weekly Wrap Up (Nov 06 – Nov 10, 2023)

The Indian stock market indices concluded the final week of Samvat 2079 (as per the Hindu calender) on a positive note, extending their winning streak for the second week in a row, which ended on November 10. This was despite market volatility influenced by factors such as easing US treasury yields, a drop in crude oil prices, and comments from the Fed chair regarding potential future rate hikes.
Indices Weekly Performance

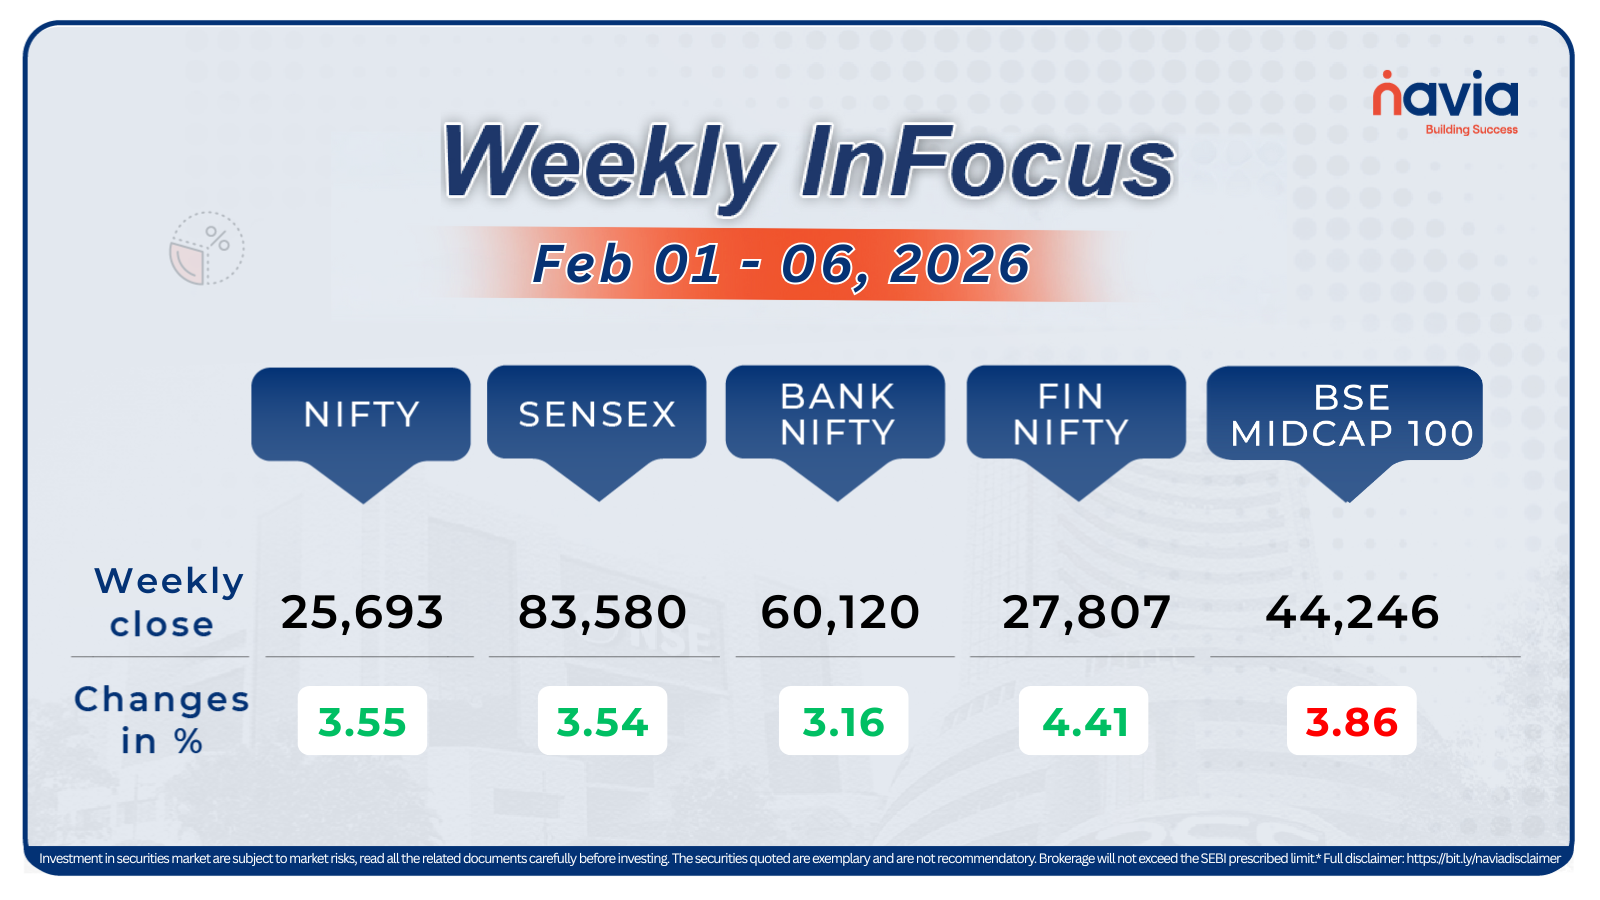
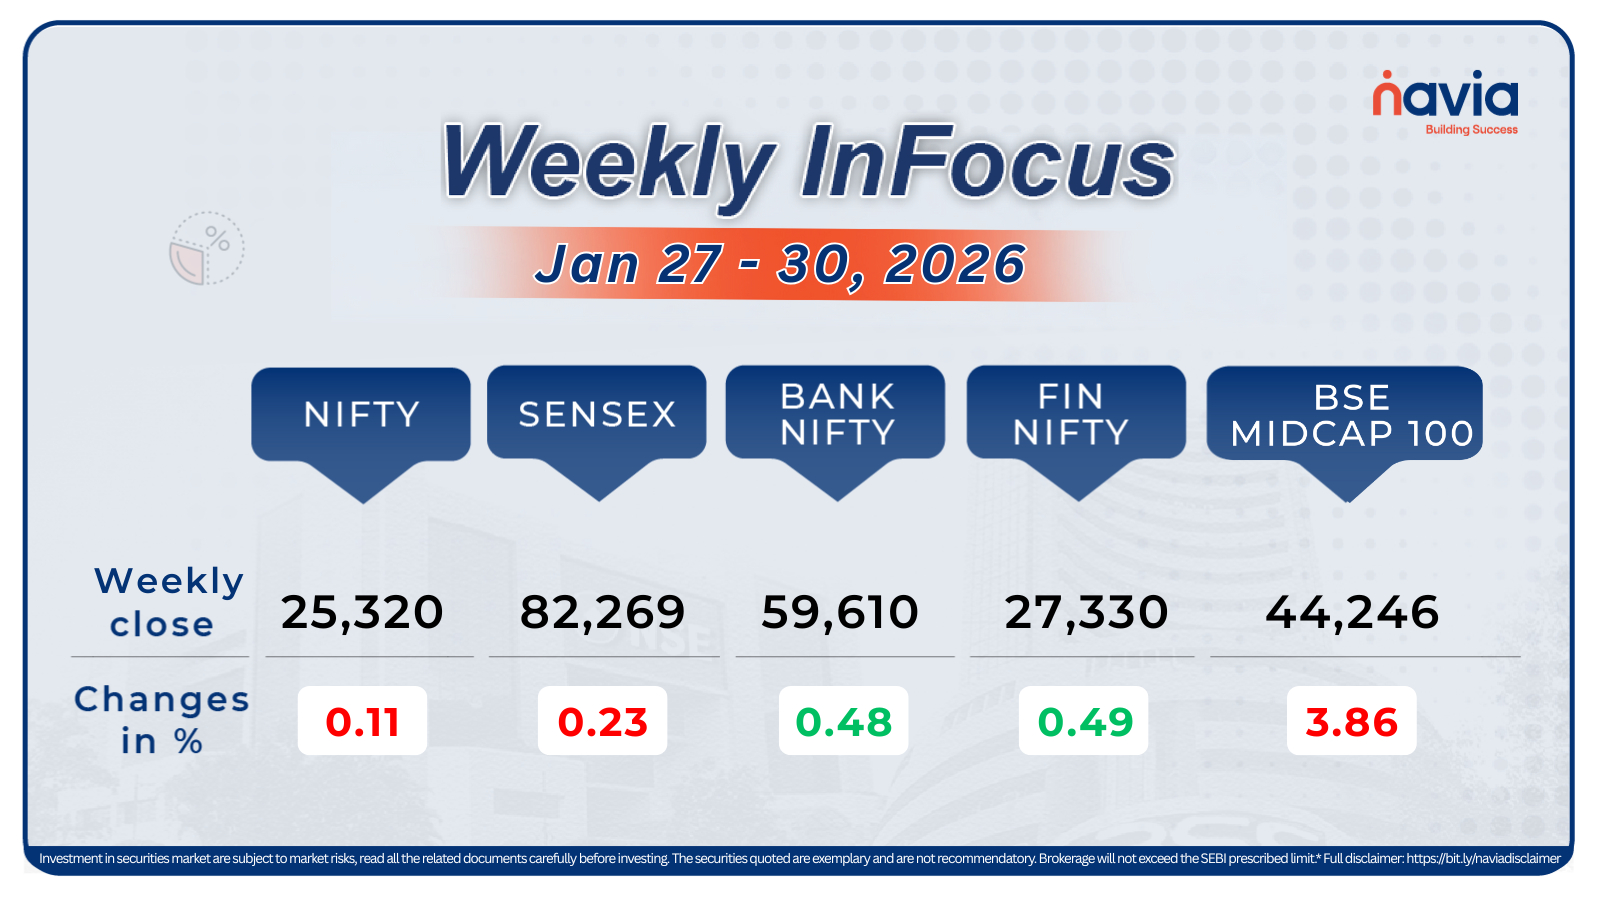
In this week, the BSE Sensex gained 0.84 percent or 540.9 points to close at 64,904.68, while the Nifty50 rose 194.75 points or 1 percent to close at 19,425.35.
Indices Analysis

Throughout the week, the Nifty 50 index remained in a sideways trading pattern, moving within a 200-point range and displaying limited volatility throughout the trading sessions. Currently, it is evident that the Nifty is attempting to surpass the 19,500 level, having consolidated after a gap-up surge witnessed in the previous week. There’s a likelihood that the Nifty will make an effort to close the downward gaps in the upcoming week.
The Bank Nifty (BN) indices have also exhibited similar behavior, forming lower lows and establishing consolidation zones akin to the Nifty 50 indices. On a daily time frame, the Bank Nifty has been observed to trade within a range of 300-400 points.
In summary, both the Nifty and Bank Nifty indices are displaying a comparable structure, and both are currently hovering around critical resistance levels.
Nifty Chart

As per the weekly chart analysis, the Nifty index exhibited a small positive candlestick pattern in the week ending November 10th. This candlestick pattern was positioned near the resistance levels of 19,450-19,500, which aligns with the concept of a change in polarity. A definitive breakout above 19,500 holds the potential to rekindle buying enthusiasm, potentially propelling the index towards 19,800 and beyond in the near future. Conversely, if a decline occurs, support is likely to be found in the range of 19,250-19,300.
Now with N Coins, Tradeplus customers can actually #Trade4Free.
INDIA VIX

India VIX rises by 0.12 points (2.07%), reaching 11.10, signaling an increase in market volatility.
Refer your Friends and family and GET 500 N Coins.
Use N Coins to Redeem all Charges. #Trade4Free.
Sectoral Performance

Among sectors, Pharma index rose 4 percent, Nifty Energy added 2.41 percent, Metal index up 2.58 percent, Nifty Realty index added 2.85 percent whereas Nifty IT ended up with 0.46 percent.
FII & DII Weekly Activity

Despite the ongoing selling by foreign institutional investors (FIIs) who divested equities worth Rs 3,105.27crore (net Rs. 2843.46 crore), meanwhile the domestic institutional investors (DIIs) showed their confidence in the market by acquiring equities worth Rs 4,155.23 crore (net Rs. 3332.59 crore).
Global Market

For the week, the Dow rose about 0.56 percent, the S&P 500 gained 1.17 percent, and the Nasdaq climbed 2.10 percent.
Currency Indices

The week ending on November 10 saw the rupee edging slightly lower against the US dollar, closing at 83.30, as compared to its closing of 83.29 on November 3.
Commodity Market

Gold prices inched higher in response to dovish comments from select Fed officials. However, the precious metal had lost some of its upward momentum in the past two weeks, mainly due to the Israel-Hamas conflict not escalating into a broader regional crisis.
Silver, on the other hand, remained relatively stable over the last two days, forming a bullish candle during the previous session. Despite this, silver has been on a downward trend over the course of a week.
Oil prices, in early Asian trading, exhibited minimal changes. The Saudi energy minister expressed confidence in healthy demand for oil and attributed recent price fluctuations to speculators.
Key blogs for November
Refer your Friends & Family and GET 500 N Coins.
Use N Coins to Redeem all Charges. #Trade4Free.
Happy Learning,
Team Navia
We’d Love to Hear from you-


