Weekly Wrap-Up (Nov 20 – Nov 24, 2023)

The Indian benchmark indices ended marginally higher and also extended the winning streak in the fourth consecutive week ended November 24 on the back of extended buying from FIIs, falling crude oil prices and bond yield, and the possibility of no rate hike by the US Fed going ahead.
Indices Weekly Performance

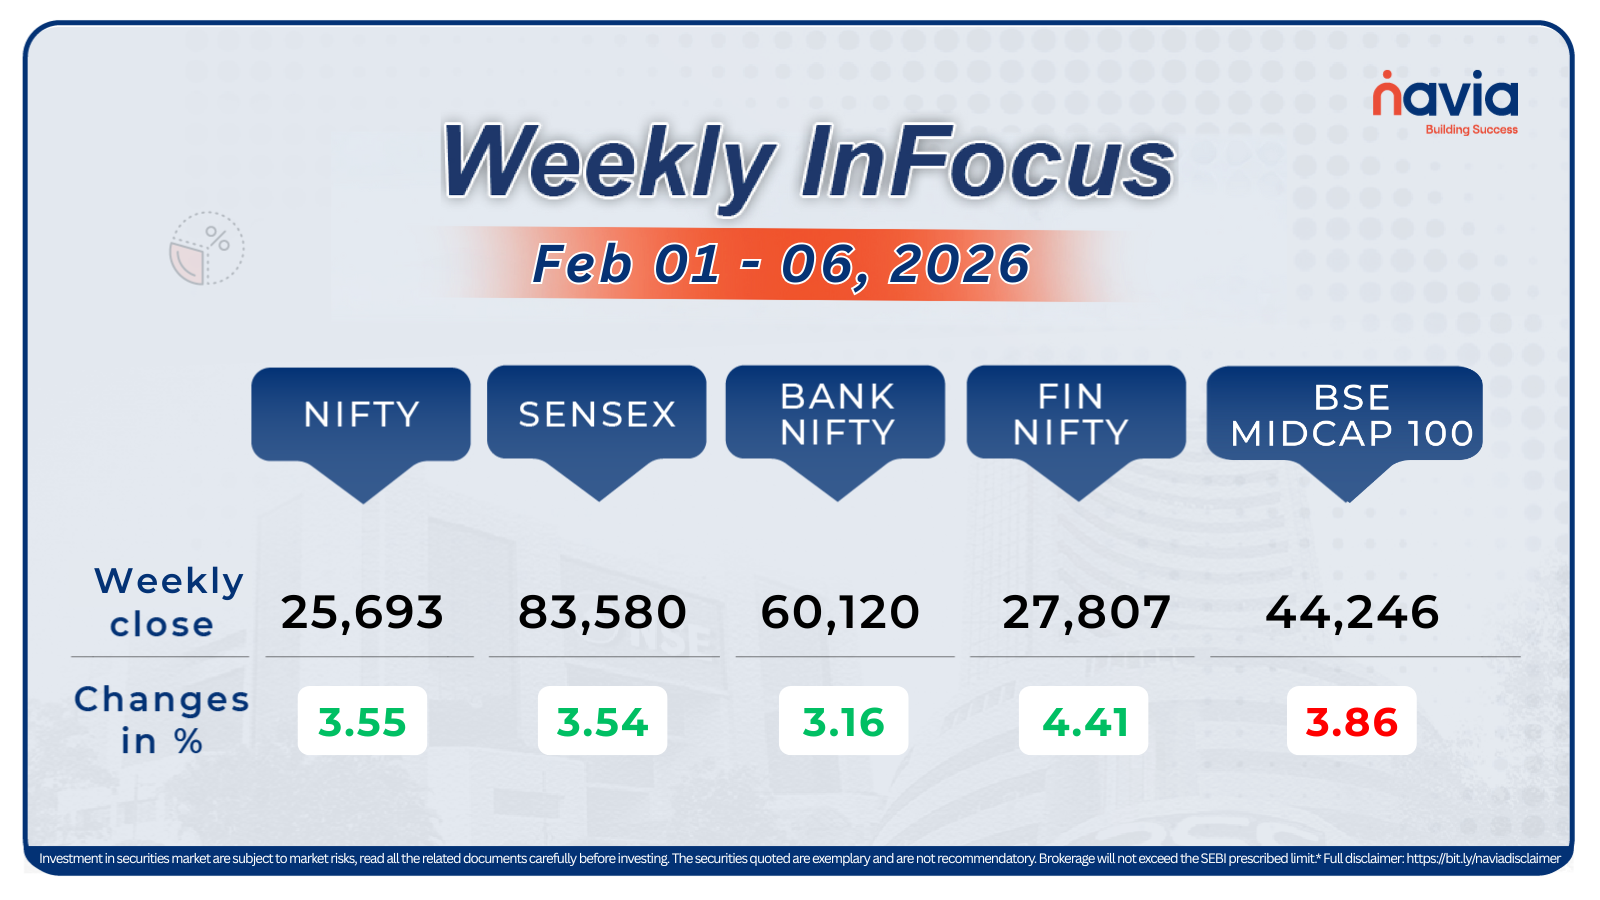
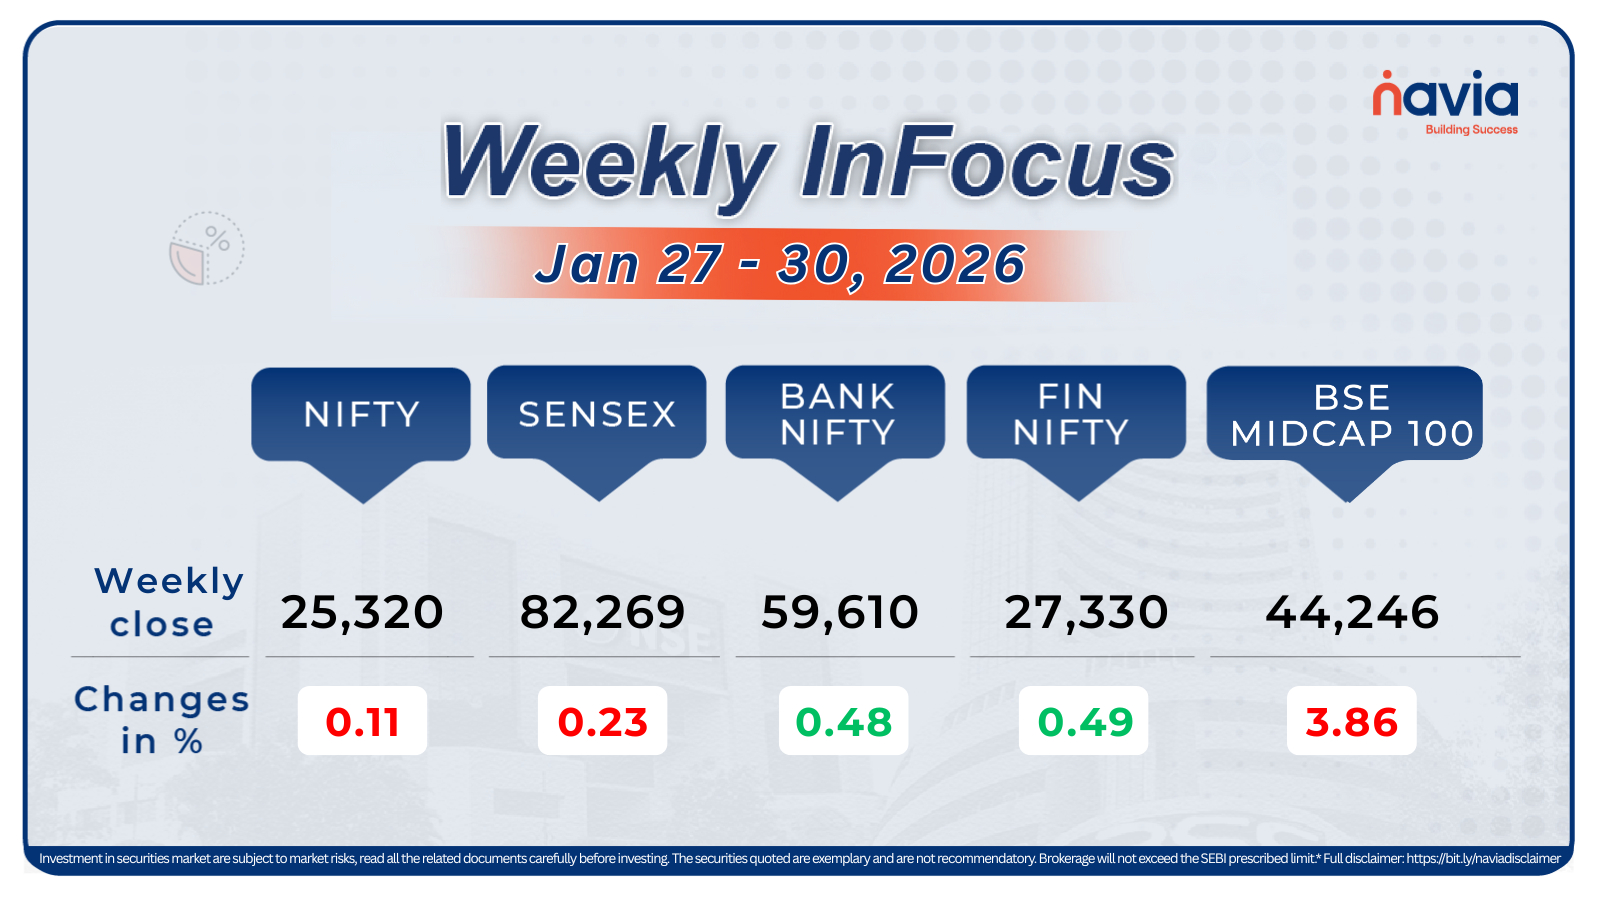
This week, BSE Sensex gained 0.27 percent points to end at 65,970, while Nifty50 rose 0.32 percent to close at 19,794
Indices Analysis

✅ Nifty 50
Nifty 50 as previously mentioned in weekly reports has behaved in a complete consolidation range of 200 pts. As on daily basis the structure was following:-
As on Monday, Nifty opened flattish and traded under pressure by providing net loss of -37 pts
As on Tuesday, Indices opened gap up and traded sideways during the day by providing net gains off 89 pts
As on Wednesday Nifty opened flat and provided both side volatility till mid -day and at the closing time Indices were observed providing buying volume.
On Thursday Nifty opened gap up by 50 pts and faced rejection from its previous resistance at 19,880 zones by closing in net loss of -9 pts
On Friday Nifty opened flattish and traded flat during the day by providing dry market structure . Overall Nifty as mentioned previous week is at a consolidation zone with a slight negative view. Any close above 19,900 zone can provide upside move
✅ Bank Nifty
BANK NIFTY Indices overall have traded sideways and on weekly basis its trading sideways by providing both side volatility during the day . As on this week Banknifty behaviour was :-
As on Monday , BN opened flattish and traded volatile during the session by providing both side volatility by forming complete neutral candle on daily time frame .
As on Tuesday, Bn indices opened gap up by 200 pts and traded sideways .
On Wednesday BN opened flat and formed a selling candle during opening time and continued the downside trend during the first half and giving a upside move in second half closed by providing net loss of -239 pts
As on Thursday BN opened flattish and traded positive during the day by providing gains of 128 pts .
On Friday BN continued the positive upside move and provided 192 pts . Overall now BN has performed volatile be closing net gains of 185 pts on weekly basis . As we can also observe BN has reacted from 200 MA on daily Time frame there can be a possibility BN may uptrend or consolidate on closing levels this week .
Nifty Chart

A small negative candle was formed on the daily chart with minor upper and lower shadows. This market action reflects sideways range movement for the Nifty, which is unfolding over the last 5-6 sessions. This is signaling that the market is waiting for the triggers to break beyond the range of 19875-19650 levels.
Now with N Coins, Navia customers can actually #Trade4Free.
INDIA VIX

A negative change of -4.21 suggests a decrease in volatility compared to the previous period. A decline in VIX usually corresponds to a reduction in market fear or uncertainty.
Refer your Friends and family and GET 500 N Coins.
Use N Coins to Redeem all Charges. #Trade4Free.
Sectoral Performance

Among sectors, Nifty Realty index rose 1.48 percent, Nifty Metal up by 1.03 , Pharma indices up 0.95 percent . On the other hand, Nifty PSU Bank index is down 1.73 percent and Nifty Information Technology index down 0.42 percent.
FII & DII Weekly Activity

Overall FII’s have been positive in cash markets while DII’s are also positive by being net buyers this week
Global Market

GIFT Nifty :- Gift Nifty has closed with a gains of 27 pts
Dow Jones :- DJI has closed with a gains 442 pts
Nasdaq :- Nasdaq has has closed with gains 144.02 pts
S&P 500:- SPX has closed with a gains of 45.30 pts
Currency Indices

Indian rupee ended lower versus the US dollar, as it lost 15 paise to finish at 83.32 in the week ended November 20 against November 17 closing at 83.27.
Commodity Market

Gold on a second weekly gain due to a weaker US dollar, anticipating a looser monetary policy next year. Bullion is just below $2,000 an ounce, benefitting from a 30% chance of the Federal Reserve lowering rates by March. This, along with a weaker dollar, boosts gold’s appeal
Blogs of the week


DID YOU KNOW?
Rupee Cost Averaging
Rupee cost averaging involves investing a fixed amount of money at regular intervals, regardless of the current price or market conditions.
This strategy allows investors to buy more shares when prices are low and fewer shares when prices are high.
For example, suppose you start investing Rs 1,000 every month in Mutual funds.
In the first month, you get 2.8 units of the fund for Rs 357.14 per unit.
In the second month, the price of each unit increases due to rise in stock markets, so you get lesser units. This time, you get 2.1 units for Rs 1,000 since each unit is now costlier.
In the third month, the markets fall and you get more units for Rs 1,000 – 4.1 units.
By the end of three months, you have 9 units of the Mutual funds at an average cost of approximately Rs 333 per unit.
Over the long term, Rupee cost averaging helps reduce the risk of making large investments at the wrong time.

Refer your Friends & Family and GET 500 N Coins.
Use N Coins to Redeem all Charges. #Trade4Free.
Happy Learning,
Team Navia
We’d Love to Hear from you-
DISCLAIMER: Investments in the securities market are subject to market risks, read all the related documents carefully before investing. The securities quoted are exemplary and are not recommendatory. Brokerage will not exceed the SEBI prescribed limit.


