Weekly Wrap-Up (JAN 15 – JAN 20, 2024)

Indices Weekly Performance
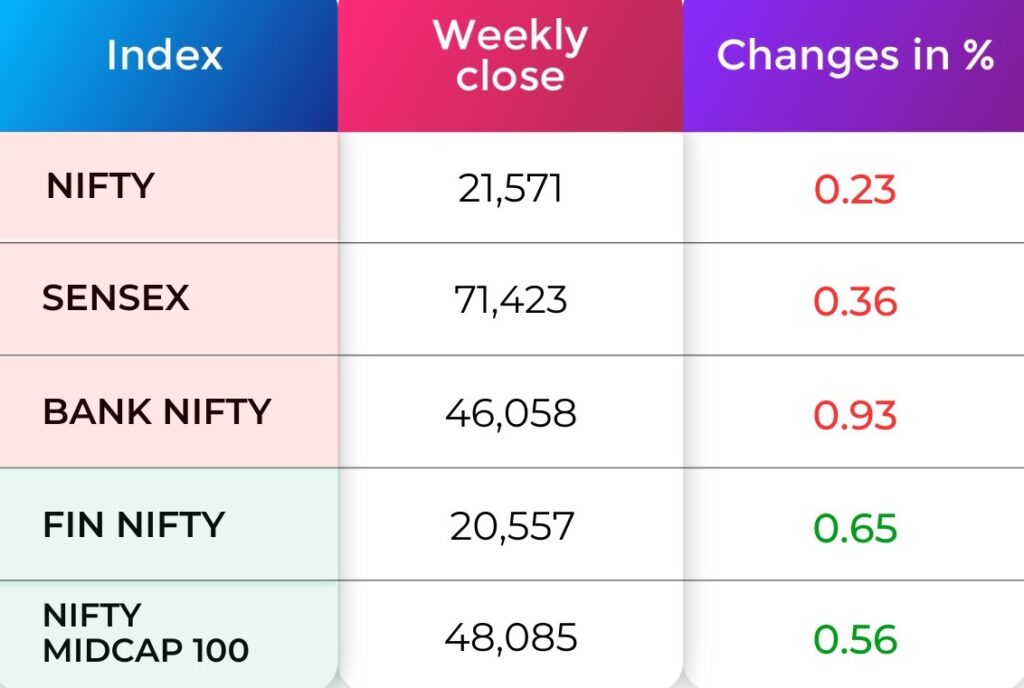
At close on January 20, the Sensex was down 0.36 percent at 71,423. and the Nifty was down 0.23 percent at 21,571. Markets closed in the red after seeing a brief breather on January 19.
For any further queries, you can now contact us on WhatsApp!
Indices Analysis

NIFTY 50
the Nifty has formed long bearish candle on weekly charts and it is trading below 20 day SMA (simple moving average) which indicating further weakness from the current levels. 20-day SMA or 21,700 would act as a crucial resistance zone for the short-term traders. Below the same, the market could correct till 21,400. Further down side may also continue which could drag the index till 21,250, On the flip side, above 20-day SMA, Nifty could move up till 21,820
BANK NIFTY
On the Bank Nifty, the index needs to overcome the immediate resistance at 46,300
A breakthrough that could trigger short-covering, propelling it towards 46,500/46,800 levels. However, a close below the crucial support of 45,600 might instigate a substantial downside correction towards 44,000
Nifty Chart
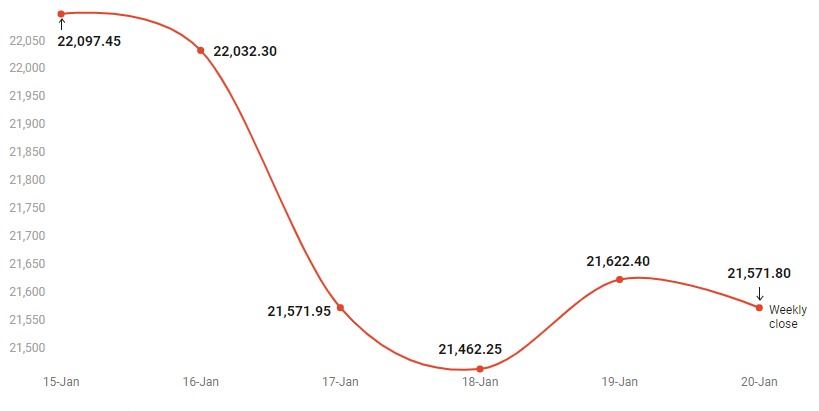
The Nifty remained volatile throughout the Week. The overall consolidation phase may persist for the next few days or until the Nifty stays within the range of 21500-21700. Only a decisive breakout on either side could initiate a directional move. A significant decline below 21500 might trigger a correction towards 21300 and below. Conversely, a robust breakout above 21700 is needed for a resumption of the uptrend.
Now with N Coins, Navia customers can actually #Trade4Free.
INDIA VIX

The drop of 0.07 points in India VIX to 13.80 suggests a moderate decrease in market volatility.
Refer your Friends and family and GET 500 N Coins.
Use N Coins to Redeem all Charges. #Trade4Free.
Sectoral Performance
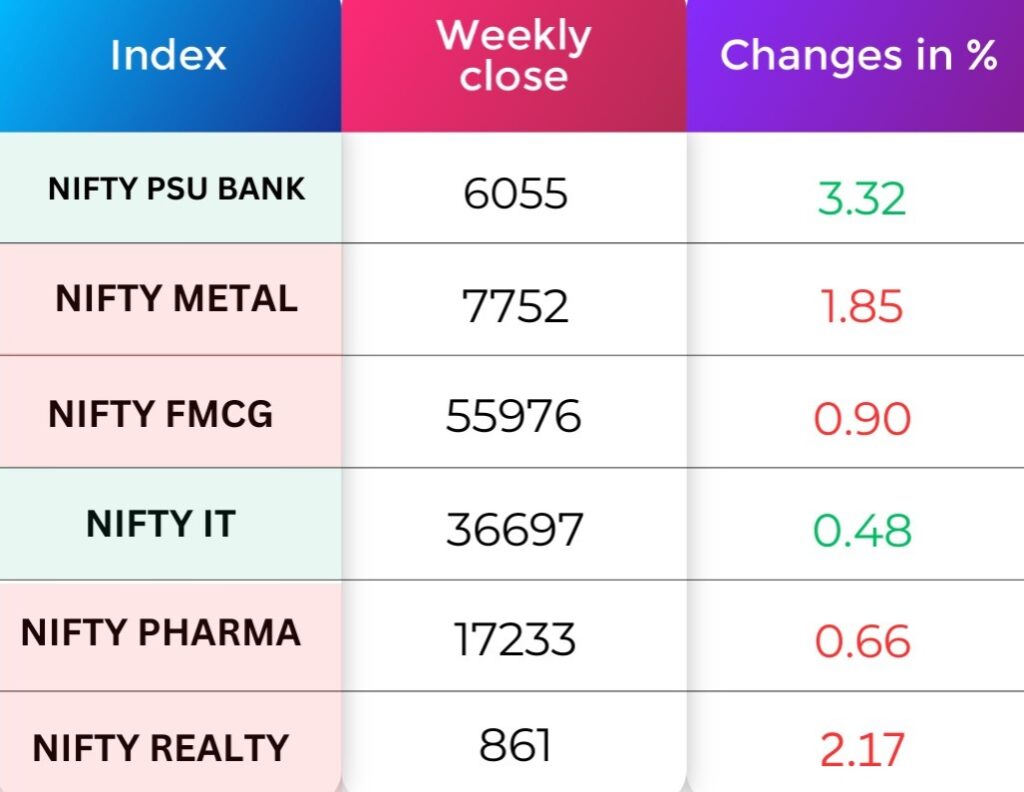
On the sectoral front, PSU BANK added 3.32%, NIFT IT was up 0.48 percent, while METAL dropped 1.85% and realty was down 2.17 percent.
FII & DII Weekly Activity
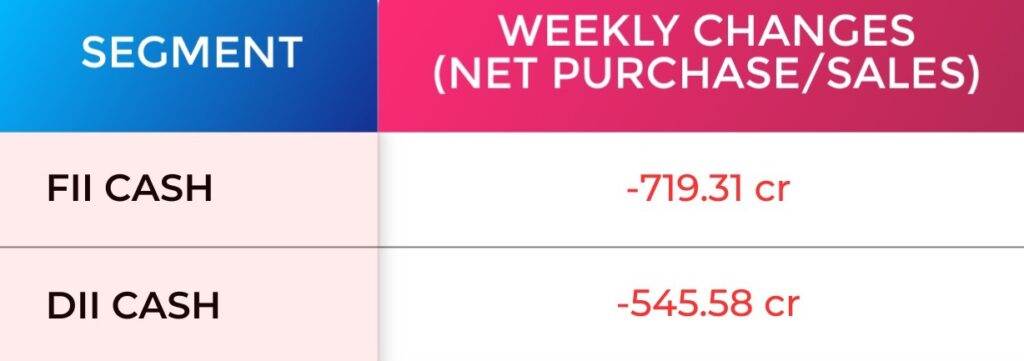
Foreign institutional investors (FIIs) turned net sellers this week, as they sold equities worth Rs.851.16 crore, while Domestic institutional investors (DIIs) bought equities worth Rs 3,467.93 crore.
Global Market
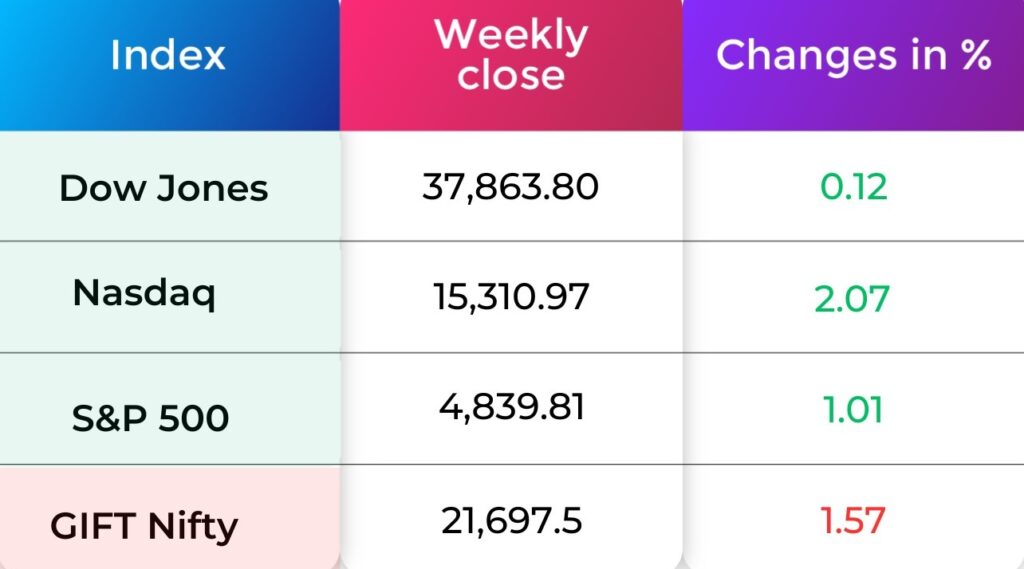
The S&P 500 achieved a record-high close for the first time in two years, driven by a surge in chipmakers and prominent technology stocks, fueled by optimism surrounding artificial intelligence.
The S&P 500 surged by 1.01%, concluding the week at 4,839.81 points.
The Nasdaq recorded a 2.70% increase, reaching 15,310.97 points, while the Dow Jones Industrial Average climbed O.12% to 37,863.80 points.
Currency Indices
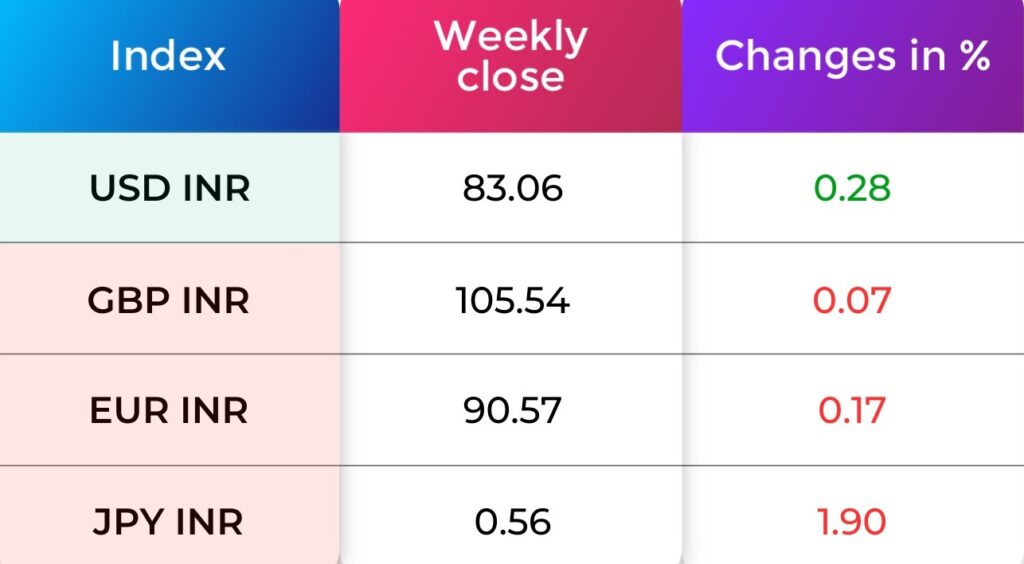
This week, the Indian rupee closed lower against the US dollar. The domestic currency dropped 23 paise to end at 83.06 in the week ended January 20 against the January 12 closing of 82.83.
Poll of the week
Last week’s poll:
Q) Who is the securities and commodity market regulator in India?
a) National Bank for Financing Infrastructure and Development (NaBFID)
b) Securities and Exchange Board of India (SEBI)
c) Reserve Bank of India
d) Bombay Stock Exchange Submit
Last week’s poll answer: b) Securities and Exchange Board of India (SEBI)
Commodity Market
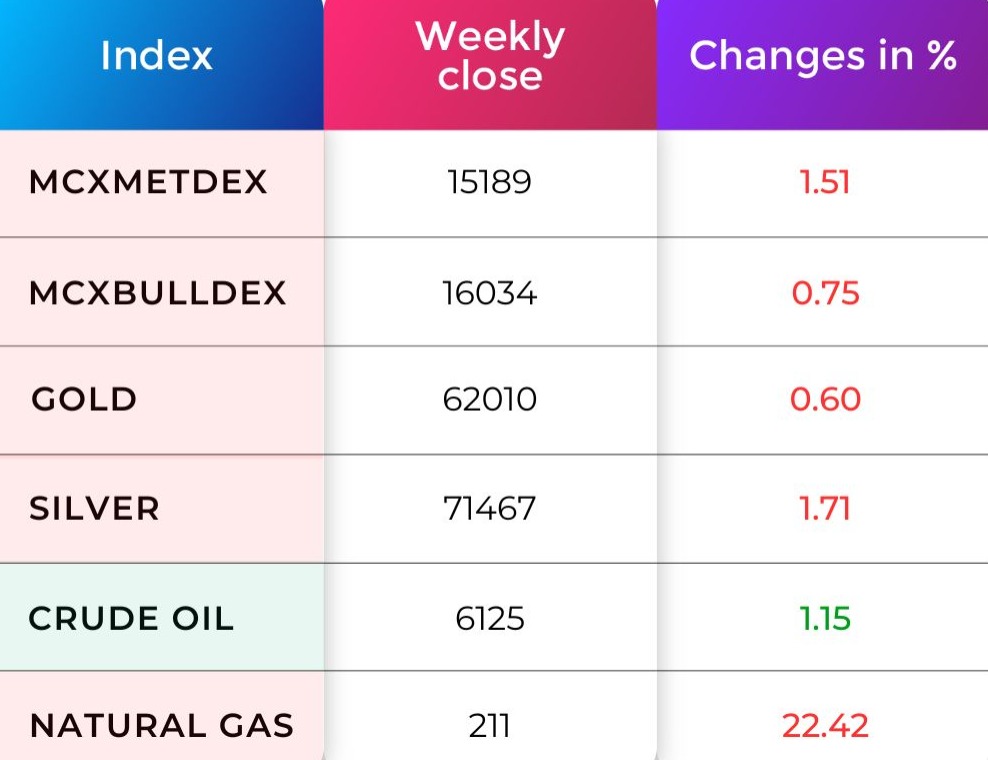
In the previous Week, crude oil opened on a flat note and formed a bearish candle with a long upper shadow. This weakness is attributed to global oil supplies expected to remain adequate, despite geopolitical risks in the Middle East, which are putting downward pressure on crude prices. A weaker dollar on Friday limited losses in energy prices. The current R1 is placed at 6240, and S1 is placed at 6010.
Gold formed a bearish candle and closed 0.60% negative. However, gold futures movement is now showing positive momentum, influenced by very strong buying activity in China, which is providing support for gold prices.The current R1 is placed at 62,163, and S1 is placed at 60,861.
Blog Of The Week

Did you Know?
The Art of Diversification in Investing!
For many new investors, diversification is often misunderstood. It’s not just about the quantity of stocks but the types. Owning numerous shares in a single sector doesn’t necessarily equal diversification.
Consider Investor A with 10 shares in 20 banking companies – it seems diversified, but it’s concentrated in one sector. On the other hand, Investor B holds 10 shares in 7 companies spanning different sectors, showcasing true diversification.
Diversifying isn’t a numbers game; it’s about strategically spreading investments across various sectors. This approach helps mitigate risks associated with a single industry downturn, creating a more resilient portfolio.
So, the next time you diversify, remember: it’s not just about having many stocks; it’s about having the right mix from different sectors. In investing, the art of diversification can be the key to safeguarding your portfolio against unexpected market swings.
Happy investing!
Refer your Friends & Family and GET 500 N Coins.
Use N Coins to Redeem all Charges. #Trade4Free.
Do You Find This Interesting?
Happy Learning,
Team Navia
We’d Love to Hear from you-
DISCLAIMER: Investments in the securities market are subject to market risks, read all the related documents carefully before investing. The securities quoted are exemplary and are not recommendatory. Brokerage will not exceed the SEBI prescribed limit.


