

The Reversal Powerhouse: Mastering the Three Outside Up Pattern
- What is the Three Outside Up Candlestick Pattern?
- The Psychology: Why It Works
- The Bearish Counterpart: Three Outside Down Candlestick Pattern
- Trading Strategies for Maximum Gains with Three Outside Up Candlestick Pattern
- Difference Between Three Outside Up and Three Inside Up
- Common Mistakes to Avoid
- Conclusion
- Frequently Asked Questions
All the traders who are always looking for signals that may provide additional confirmation and provide actual confirmation. So, many start their trading journey with basic patterns like Engulfing candle, but the experienced participants in 2026 know that the some participants focus on multi-candle formations.
Let’s see the commonly used patterns by traders to spot the end of a bearish trend is the three outside up candle pattern. This formation is a commonly observed pattern that may indicate a potential price movements; it provides the buying activity exceeds selling pressure. This blog will help you understand the pattern that can help in understanding the pattern.
What is the Three Outside Up Candlestick Pattern?
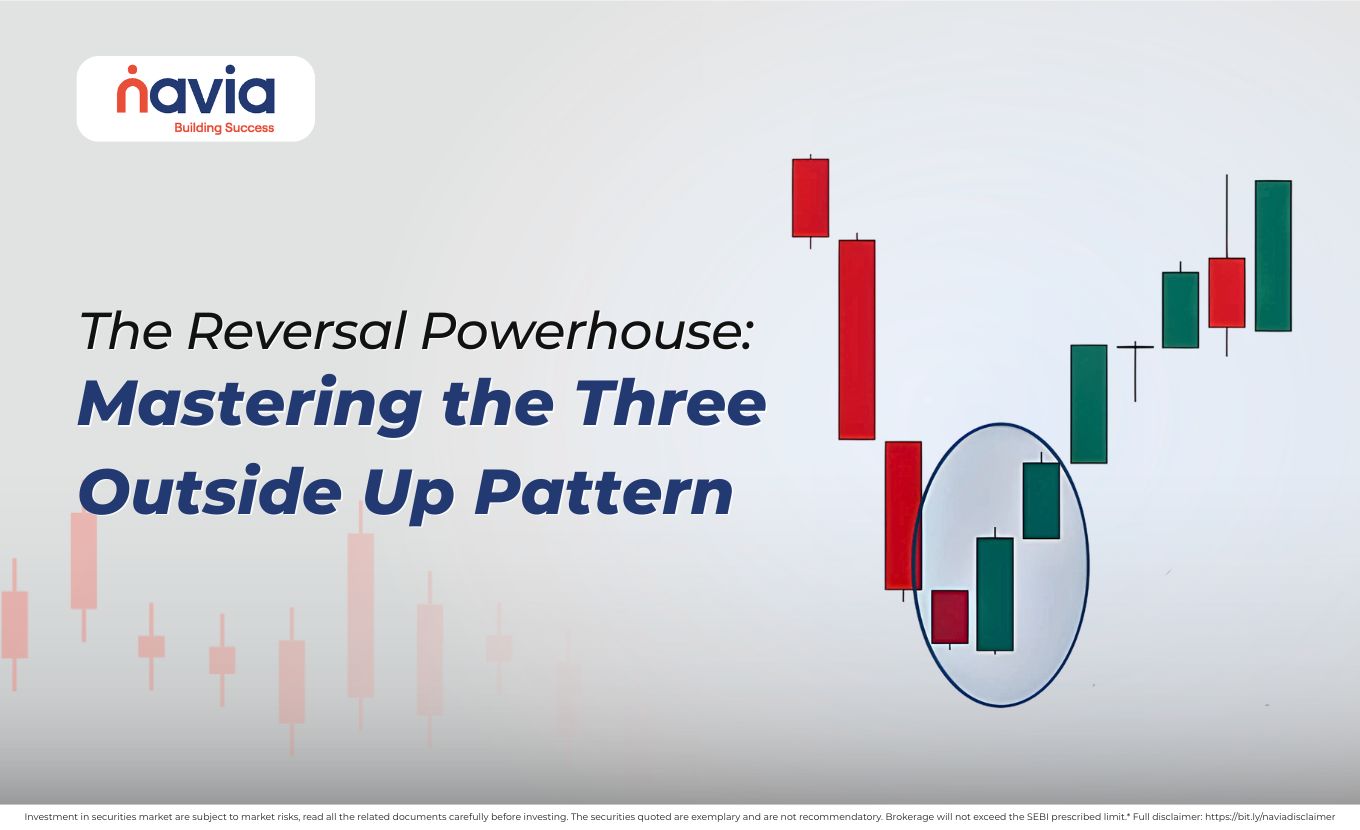
The three outside up candlestick pattern is a three-candle bullish reversal formation that typically may appear near price reversals of a downtrend. It considered an extension and a confirmation of the classic Bullish Engulfing pattern.
Identifying this pattern is a little bit difficult; you need to observe three distinct phases to identify a valid three outside candlestick pattern.
| The Bearish Tail-End | The first candle is a small bearish (red/black) candle that appears at the end of a downtrend. It represents the declining selling pressure. |
| The Bullish Engulfing | The second candle is a large bullish (green/white) candle that completely “engulfs” the body of the first candle. This shows a increase in buying activity. |
| The Confirmation | The third candle is another bullish candle that closes higher than the second candle. This may indicate continuation of price movement and not just a temporary price recovery. |
The Psychology: Why It Works
The journey with the three outside up candlestick pattern lies in the story it tells about market participants.
On the Day 1, the downward price movement is observed, but their power is fading
On Day 2, the buying activity increased significantly. By opening lower but closing significantly higher than the previous day’s opening, the bulls have effectively “trapped” everyone who was shorting the stock.
By Day 3, when the price closes even higher, those trapped shorts are may close positions their positions to cover losses, while additional buying interest may emerge. It creates a continued buying activity that may result in upward price movement.
The Bearish Counterpart: Three Outside Down Candlestick Pattern
If you want to be a balanced trader, you must recognize when the trend may change direction. The mirror images of the bullish signal are the three outside candlestick patterns. This will appear at the peak of an uptrend and may indicate a potential trend reversal to the downside:
🔸Candle 1: A small bullish candle
🔸Candle 2: A large bearish candle that engulfs the first
🔸Candle 3: A third bearish candle that closes lower than the second, confirming the new downtrend.
Spotting this three outside down candlestick pattern can monitor positions, that tells you that the some market participants may reduce positions and the upward movement may weaken.
Trading Strategies for Maximum Gains with Three Outside Up Candlestick Pattern
To understand the pattern the three outside up candle pattern, you need a disciplined approach, here is how some market participants use the signal (educational purpose only):
| Look for Confluence | A three outside candlestick pattern may be considered relevant, but it is “God-tier” when it occurs at a major support level, a Fibonacci retracement level, or near the Anchored VWAP. If the pattern forms where the average buyer’s cost basis is already being defended, the likelihood may improve. |
| Volume is the Important Factor | The second candle (the engulfing one) should ideally be backed by a increase in trading volume. High volume on the “engulfing” day proves that large market participants may indicate higher participation, not just retail traders. |
| Entry and Stop-Loss | Entry: Some traders may observe entry levels above the top of the third candle. Stop-Loss: For risk management, some traders use stop-loss levels just below the low of the second (large engulfing) candle. |

Difference Between Three Outside Up and Three Inside Up
| Features | Three Inside Up | Three Outside Up |
|---|---|---|
| Core Pattern | Built on a Bullish Harami (Day 2 is “inside” Day 1). | Built on Bullish Engulfing (Day 2 “outside” Day 1). |
| Candle Size | The second candle is smaller than the first bearish candle. | The second candle is larger than the first bearish candle. |
| Psychology | Represents a pause or halt in the downtrend; selling simply stops. | Represents a strong buying activity; buyers buying activity exceeds selling pressure. |
| Momentum | A more conservative, gradual reversal signal. | A more aggressive, relatively stronger price movement signal. |
| Visual Shape | Day 2 looks “tucked away” within the range of Day 1. | Day 2 “swallows” or covers the entire range of Day 1. |
Common Mistakes to Avoid
✔ This pattern is a reversal signal. If the market is moving sideways, the “engulfing” action is often just random price noise and may not lead to continued price movement.
✔ The “Outside Up” name requires the third candle to close above the second. Many traders enter as soon as they see the Day 2 engulfing candle, only to see Day 3 reverse back down. Never skip the confirmation.
✔ A true institutional reversal usually shows a significant “volume swell” on the second or third day. If the pattern forms at very low volume, it is likely a potentially misleading signal caused by a lack of sellers rather than an influx of strong buyers.
✔ A 15-minute Three Outside Up might look great, but if the Daily chart is in a significant donward movement, that small reversal may not perform as expected. Always ensure the pattern isn’t fighting against a much larger overhead resistance.
✔ No pattern is fully reliable. Always use a stop-loss to ensure a single bad trade doesn’t lead to significant losses.
Conclusion
The three outside up candle pattern is the commonly observed pattern in technical analysis. So, understanding the shift from bear exhaustion to bull dominance, you can use for analysis with caution that signal-candle patterns simply may not provide.
If you are looking for long-term investments or quick swing trades, keep an eye out for the “outside” engulfing move. It is often the may indicate a potential change in trend direction.
Do You Find This Interesting?
We’d Love to Hear from you-

Frequently Asked Questions
What does the three outside candlestick pattern mean?
The three outside candlestick pattern (specifically the “Three Outside Up”) is a bullish reversal signal that may indicate in a shift momentum. It consists of a small bearish candle, followed by a large bullish candle that “engulfs” the first, and a third bullish candle that closes higher than the second. It means that buyers have not only stopped the decline but have buying activity exceeds selling pressure, may indicate a potential upward trend.
What is the three upward candlestick pattern?
While “three upward” is a general term, it usually refers to the Three White Soldiers. This is a bullish reversal pattern consisting of three consecutive long-bodied green candles that each open within the previous candle’s body and close higher than the previous high. It represents a steady, consistent upward price movement with limited selling pressure observed from sellers.
How to trade three inside up candlestick patterns?
To understand this pattern, some traders consider the following approach:
➣ Identification: Wait for a small green candle to form inside the range of a large red candle at the bottom of a downtrend.
➣ Entry: Place a buy order only when the third candle closes above the high of the first (large red) candle.
➣ Risk Management: Place your stop-loss just below the low of the first candle in the pattern for risk management a trend of continuation.
What is the 3 candle rule in trading?
The 3-candle rule is a commonly discussed approach used to reduce unreliable signals. It states that a trader should wait for three consecutive candles to close in the direction of a breakout or reversal before entering a position.
☆ Candle 1: The breakout/signal candle.
☆ Candle 2: The “hold” candle that stays above the breakout level.
☆ Candle 3: The “confirmation” candle that may indicate continuation.
What does a triple top candle mean?
A triple top is a bearish reversal pattern that looks like three nearly equal peaks. It means that the price has reached a “ceiling” (resistance level) three times and failed to break through. It may indicate reduced buying interest and that the some participants may begin selling, may lead to downward price movement once the “neckline” (the low point between the peaks) is broken.
DISCLAIMER: Investment in securities market are subject to market risks, read all the related documents carefully before investing. The securities quoted are exemplary and are not recommendatory. Full disclaimer: https://bit.ly/naviadisclaimer.


