Dark Clouds on the Horizon: Understanding the Three Black Crows Candlestick Pattern
- What is the Three Black Crows Pattern?
- Anatomy of the Three Black Crows Candlestick Pattern
- Psychology Behind the 3 Black Crows Pattern
- How to Trade Using the Three Black Crows Pattern?
- Conclusion
- Frequently Asked Questions
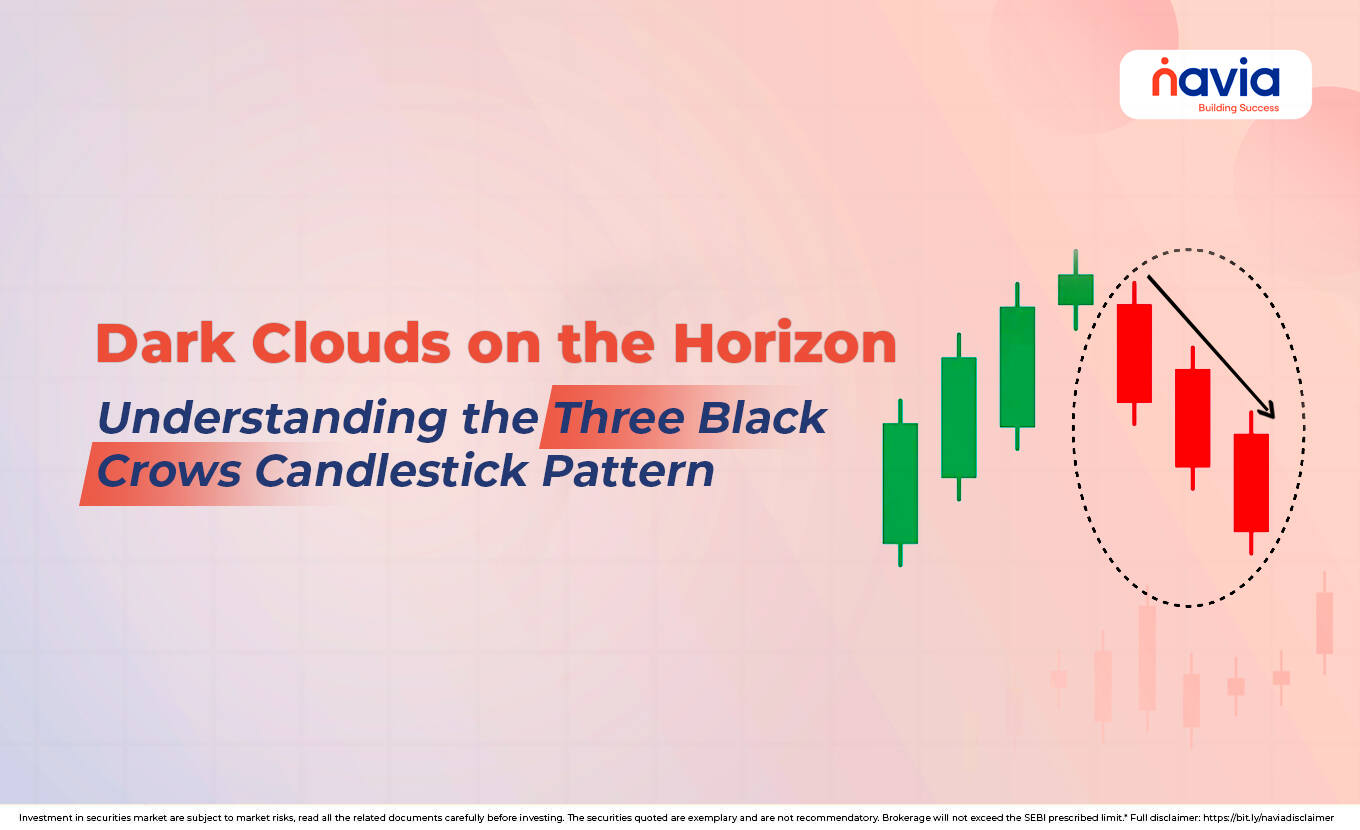
The intricate dance of the stock market, every candle tells you a story. Some whispers tales of bullish hopes and others scream warnings of bearish doom. Among the most potent and visually striking bearish reversal signals is the Three Black Crows Pattern. The three black crows candlestick pattern is like thunder for both traders and investors because of its strong indication that prevailing uptrend is likely to reverse into a significant decline.
Understanding such patterns can help investors interpret market sentiment, though patterns do not guarantee outcomes.
What is the Three Black Crows Pattern?
The Three Black Crows Pattern is a well-known bearish reversal candlestick pattern. It is composed of three consecutive long-bodied bearish (red or black) candlesticks; this strong indicator can shift market sentiment from bullish to bearish.
It suggests the individuals that previously established uptrend is likely to end, giving way to a new downtrend. That will guide them to make effective decisions in the volatile market. Like the name, the “Three Black Crows” will evoke the imagery of an unpromising presence that predicts the movement of the market.
Anatomy of the Three Black Crows Candlestick Pattern
The three black crows candlestick pattern has a distinct visual structure and is crucial for its interpretation. The three-candle formation defined by these characteristics:
| Characteristics | Definition |
|---|---|
| Three Consecutive Bearish Candlesticks | The pattern consists of three successive long-bodied bearish candles. These are typically red or black, indicating that the closing price was lower than the opening price for each of the three periods. |
| Progressively Lower Closes | Each of the three bearish candles must close progressively lower than the previous day’s close. This demonstrates persistent and increasing selling pressure. |
| Opens Within the Previous Real Body | Each candle should open within the real body of the preceding candle. It means the buyers are making an attempt at the start of each period, but they failed to sustain the rally. |
| Small or Non-Existent Lower Wicks | Ideally, these candles should have small or no lower wicks. That signifies the selling pressure dominated throughout the period. |
| Long Real Bodies | The real bodies of the candles should be relatively long. This indicates significant price movement (selling) during each session. |

Psychology Behind the 3 Black Crows Pattern
The 3 black crows candlestick pattern tells you a compelling story of market exhaustion and a decisive shift in control. Let’s see the in-depth psychology of it;
First Crow (The Warning)
The market opens after an uptrend; the sellers manage to drive the price significantly lower, closing the day deep in bearish territory. The bull might dismiss this as profit-taking, but it’s the first crack in their dominance.
Second Crow (Confirmation)
The very next day, the market opens the rally with the previous day’s bearish body. So, the sellers overwhelmed this attempt, that pushed the price lower compared to the previous day’s closing. It will confirm that the selling pressure isn’t a one-off event.
Third Crow (Surrender)
On the third day, the pattern repeats. Bulls will attempt to increase the prices at the open but fail again. The sellers establish firm control and close the day even lower, often with panic selling. This day bearish will close and lower the price then signal the bull’s surrender.
How to Trade Using the Three Black Crows Pattern?
The three black crows pattern is a strong signal, but like all indicators, it requires context and a disciplined trading strategy.
| Context is Paramount | Ensure the pattern occurs at a critical juncture: at the peak of a noticeable uptrend or near a historically significant resistance level. |
| Confirmation is Key | While the three black crows candlestick pattern itself is a strong reversal signal, waiting for further confirmation like price action and volume confirmation. |
| Entry and Stop-Loss | After confirmation: Entry: Enter a short (sell) position when the price breaks below the low of the third black crow. Stop-Loss (SL): Place your stop-loss order slightly above the high of the first black crow. This point represents the highest price the bulls could achieve before their capitulation. Take Profit: Target the nearest significant support level from prior price action or use a trailing stop-loss to ride the potential downtrend for maximum profit. |
Conclusion
The Three Black Crows Candlestick Pattern is a powerful visual alert that the bullish party is over, and a bearish takeover is underway. Without understanding the anatomy, psychology and trading implications of the three black crows candlestick patterns, you can’t navigate the volatile market.
First, learn to spot this pattern, waiting for confirmation, then apply strict risk management to protect your long positions from significant drawdowns. And always remember when you see the three black rocks, it’s time to prepare for a shift in the market direction.
Do You Find This Interesting?
We’d Love to Hear from you-

Frequently Asked Questions
What does 3 black crows mean in trading?
The Three Black Crows pattern means a strong bearish trend of reversal is highly likely after an established uptrend. It consists of three consecutive long-bodied red (or black) candles, where each candle opens within the previous day’s body and closes progressively lower. This signifies that the sellers have decisively taken control of the buyers, indicating a shift from an uptrend to a new downtrend.
What does it mean when you see Three Black Crows?
When you see the Three Black Crows, it means that the selling pressure is persistent and intense. It is a warning signal for investors holding long positions to consider exiting to protect their gains and an entry signal for traders looking to initiate a short (sell) position.
What is the success rate of the Three Black Crows?
The exact statistical success rate of the Three Black Crows pattern varies widely depending on the market, timeframe, and whether other confirming indicators are used.
How reliable is the Three Black Crows pattern?
The Three Black Crows pattern is highly reliable because it is based on three consecutive periods of sustained selling, which confirms a definitive shift in market sentiment. Its reliability is enhanced when:
➣ The bodies are long and the wicks are short (showing dominance).
➣ It forms at a known resistance level or after a prolonged uptrend.
➣ The bearish candles are confirmed by increasing trading volume.
How to trade Three Black Crows pattern?
The recommended way to trade the Three Black Crows pattern is:
◆ Confirmation: Wait for the candle immediately following the third crow to close lower than the third crow’s low.
◆ Entry: Enter a short (sell) trade just below the low of the third crow.
◆ Stop-Loss (SL): Place the stop-loss order above the high of the first candle in the pattern.
◆ Take Profit (TP): Target the nearest significant support level.
DISCLAIMER: Investment in securities market are subject to market risks, read all the related documents carefully before investing. The securities quoted are exemplary and are not recommendatory. Full disclaimer: https://bit.ly/naviadisclaimer.