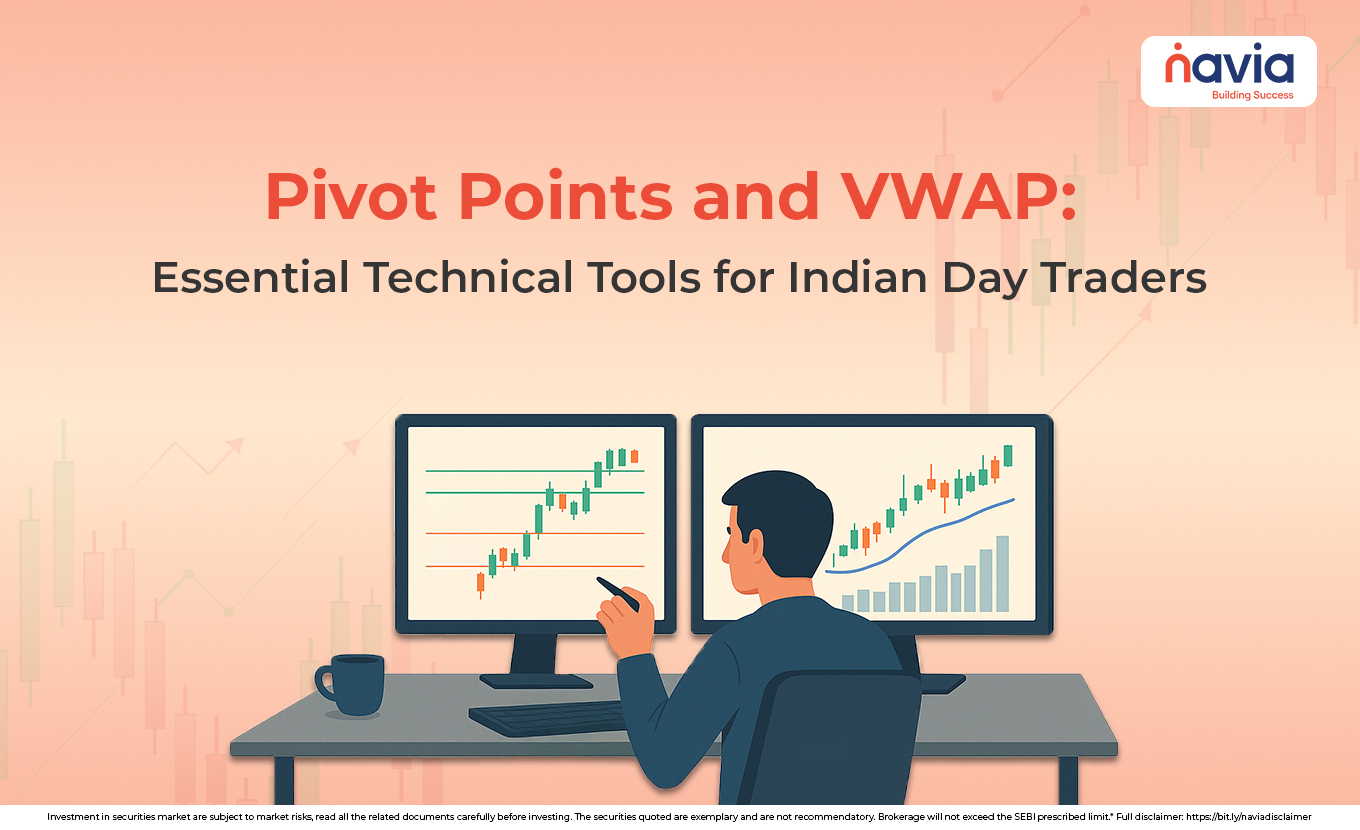
Pivot Points and VWAP: Essential Technical Tools for Day Traders

- Decoding Pivot Points (The Fixed Compass)
- Embracing VWAP (The Dynamic Benchmark)
- Conclusion
- Frequently Asked Questions
To succeed in the world of day trading demands quick thinking, discipline, and importantly the use of the right tools. We know that day traders operate within a limited time frame and aim to profit from intraday price fluctuations. To navigate this volatility, traders are heavily relying on technical indicators that offer clear, objective levels for entry, exit and risk management.
Here we are talking about the essential and widely respected tools, that are pivot points and the Volume-Weighted Average Price (VWAP). In a simple word, one tool provides fixed, predetermined support and resistance levels, and the other one offers a dynamic, volume-sensitive benchmark. Let’s dive into the blog.
Decoding Pivot Points (The Fixed Compass)
What is pivot points in trading? It is a calculation derived from the previous day’s data – mainly the high, low, and closing prices. If you want to know the overall market bias of a particular day, you can use this tool. Because it represents a potential turning point where price action might reverse or consolidate.
Pivot points will determine the overall market bias like;
➣ Bullish Bias: The assets price is trading above the main pivot point
➣ Bearish Bias: The assets price is trading below the main pivot point
The Pivot Point Indicator: Support and Resistance Levels
The main pivot point (P) is the foundation for calculating a series of related support (S) and resistance (R) levels, which remain fixed throughout the entire trading day:
Let’s see it in a simple way;
| Level | Description |
|---|---|
| P | The main pivot point |
| R1, R2, R3 | Resistance levels 1, 2, and 3 |
| S1. S2, S3 | Support levels 1, 2, and 3 |
Calculation
The modern trading platforms will calculate these levels automatically, but the classic five-points system use these formulas:
Pivot Point (P) = {Previous Day’s High} + {Previous Day’s Low} + {Previous Day’s Close}/3
Resistance 1 (R1) = (2 * P) – Previous Day’s Low
Support 1 (S1) = (2 * P) Previous Day’s High
Resistance 2 (R2) = P + {Previous Day’s High – Previous Day’s Low}
Support 2 (S2) = P – {Previous Day’s High – Previous Day’s Low}
Pivot Point Trading Strategy
There are two primary pivot point trading techniques that are mainly used for effective trading using pivot points. Both are explained below;
| Pivot Point Bounce Strategy (Reversal) | Pivot Point Breakout Strategy (Continuation) |
|---|---|
| Based on the idea that prices often respect established support and resistance levels. Long Entry: Enter a long position when the price drops to a support level (S1 or S2) and shows a clear sign of reversal. Short Entry: Enter a short position when the price rallies to a resistance level (R1 or R2) and shows a clear sign of reversal. Target: The immediate target is usually the main Pivot Point (P) or the next S/R level. | Capitalizes strong momentum when the price slices through a major level. Long Entry: Enter a long position when the price decisively breaks and closes above an R1 or R2 level, indicating bullish momentum. Short Entry: Enter a short position when the price decisively breaks and closes below an S1 or S2 level, indicating bearish momentum. Target: The target is typically the next calculated pivot level. |

Embracing VWAP (The Dynamic Benchmark)
While pivot points are offering fixed levels, modern-day trading also needs a dynamic tool that incorporates the most crucial factor: volume. Here is Volume-Weighted Average Price (VWAP) that gets all the attention.
So, what is VWAP? It is a technical indicator that measures the average price of security throughout the day. Means, that prices where more volume was traded have a greater influence on the average. VWAP accounts for how many shares were exchanged at each price point; that’s why it’s considered the true average price.
Why is VWAP Essential?
🔹 Institutional Benchmark: Large institutional traders like mutual funds or hedge funds using VWAP as their benchmark to ensure the execution of large orders without moving the market price. They take decisions strategically, like buying below VWAP and selling above VWAP.
🔹 Dynamic Support/Resistance: If the price is above VMAP suggests buyers are in control and it acts as support. But if the price is below VMAP suggests sellers are in control and it acts as resistance.
🔹 Confirming Trends: The VMAP lines would help to confirm the intraday trend, if its rising indicated an uptrend and falling indicates a downtrend.
Calculation
By using the formula, you can calculate a running total throughout the particular day.
VWAP = Cumulative (Price * Volume)/Cumulative Volume
Since the calculation is cumulative, VWAP is a single-day indicator that resets every morning, making it purely an intraday tool.
VWAP Trading Strategy
The most common way to trade using VWAP is based on mean reversion and breakouts:
| Mean Reversion | Breakout/Breakdown |
|---|---|
| In a strong uptrend, look for the price to pull back to the rising VWAP line. Enter a long position when the price touches and bounces off the VWAP, using the line as dynamic support. | It includes long and short entries; long entry means entering when the price breaks and closes above the VWAP line, and it signals buyer momentum. Short entry means entering when the price breaks and closes below the VWAP line and signaling seller momentum. |
Conclusion
Now you are aware of pivot points trading that provides a structural map of the market by using fixed, historically reliable support and resistance levels. VWAP offers the pulse of the market, confirming trends and fair value based on volume. So, if you are using these tools together, you can move beyond relying on guesswork, and you get a clear strategy that enhances your confidence.
Do You Find This Interesting?
Frequently Asked Questions
What are pivot points in trading?
Pivot points are a classic technical analysis indicator used primarily by intraday traders to determine potential support and resistance levels for the current trading day.
Is VWAP good for day trading?
Yes, VWAP is excellent and considered essential for day trading. It provides the Volume Weighted Average Price of security since the market opened. Institutional traders and fund managers use it as a benchmark to assess the “fair price” for the day.
Is VWAP better than MACD?
VWAP is superior for determining intraday fair value and support/resistance for quick, short-term trades. MACD is better for confirming overall trend momentum. Many traders combine the two for stronger entry and exit signals.
What are the best indicators to use with pivot points?
Pivot points provide price levels, so they are best combined with momentum and trend confirmation indicators to avoid false signals:
MACD (Moving Average Convergence Divergence): To confirm the strength of a price breakout above or below a pivot level.
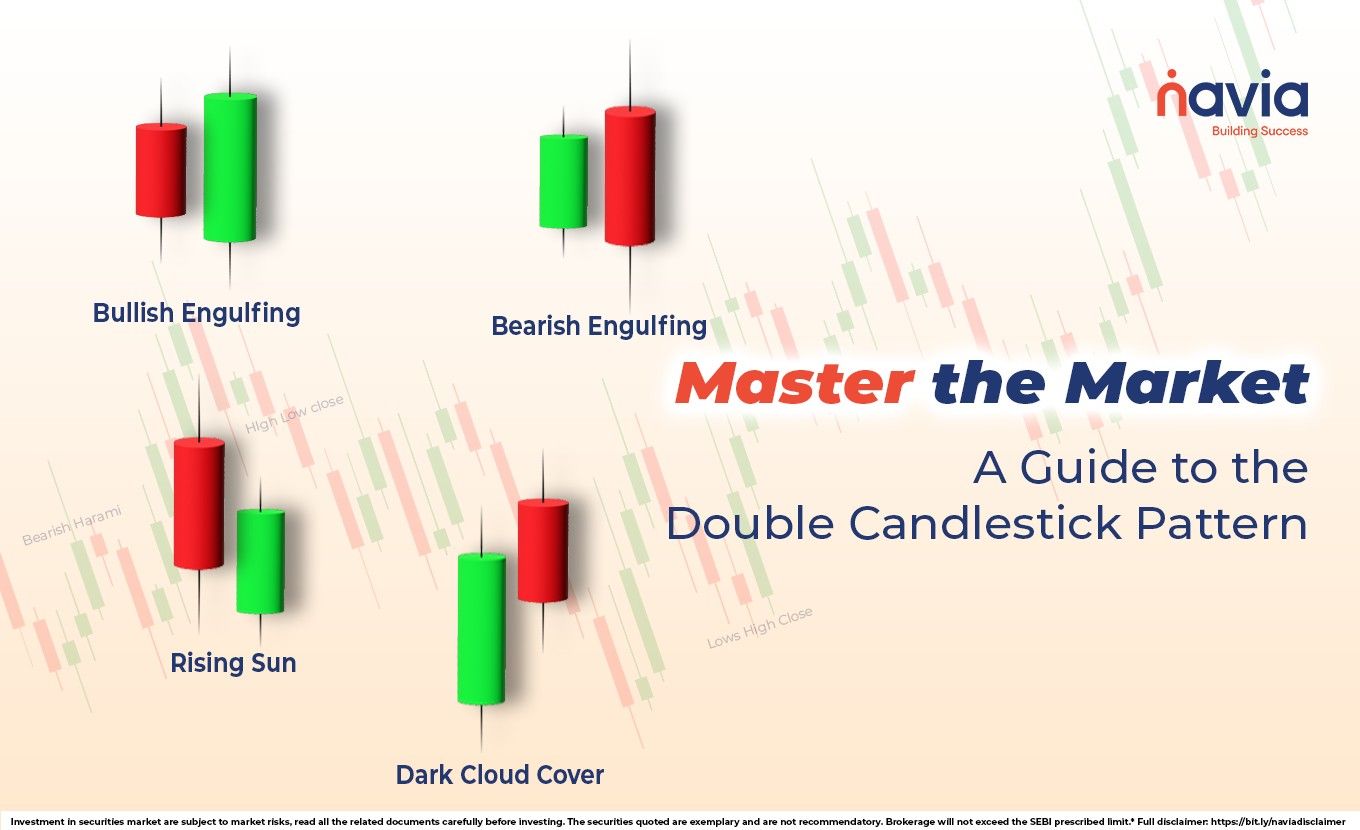
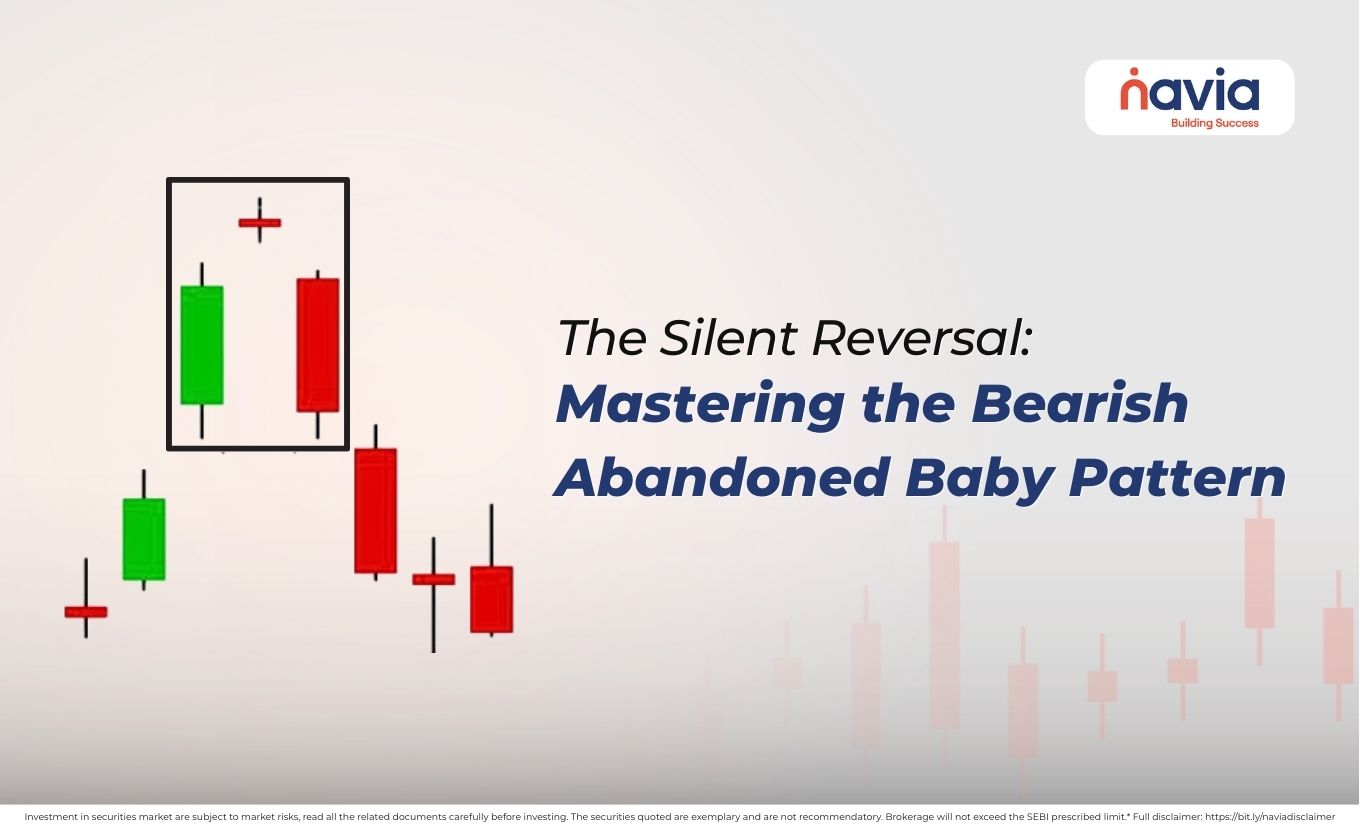
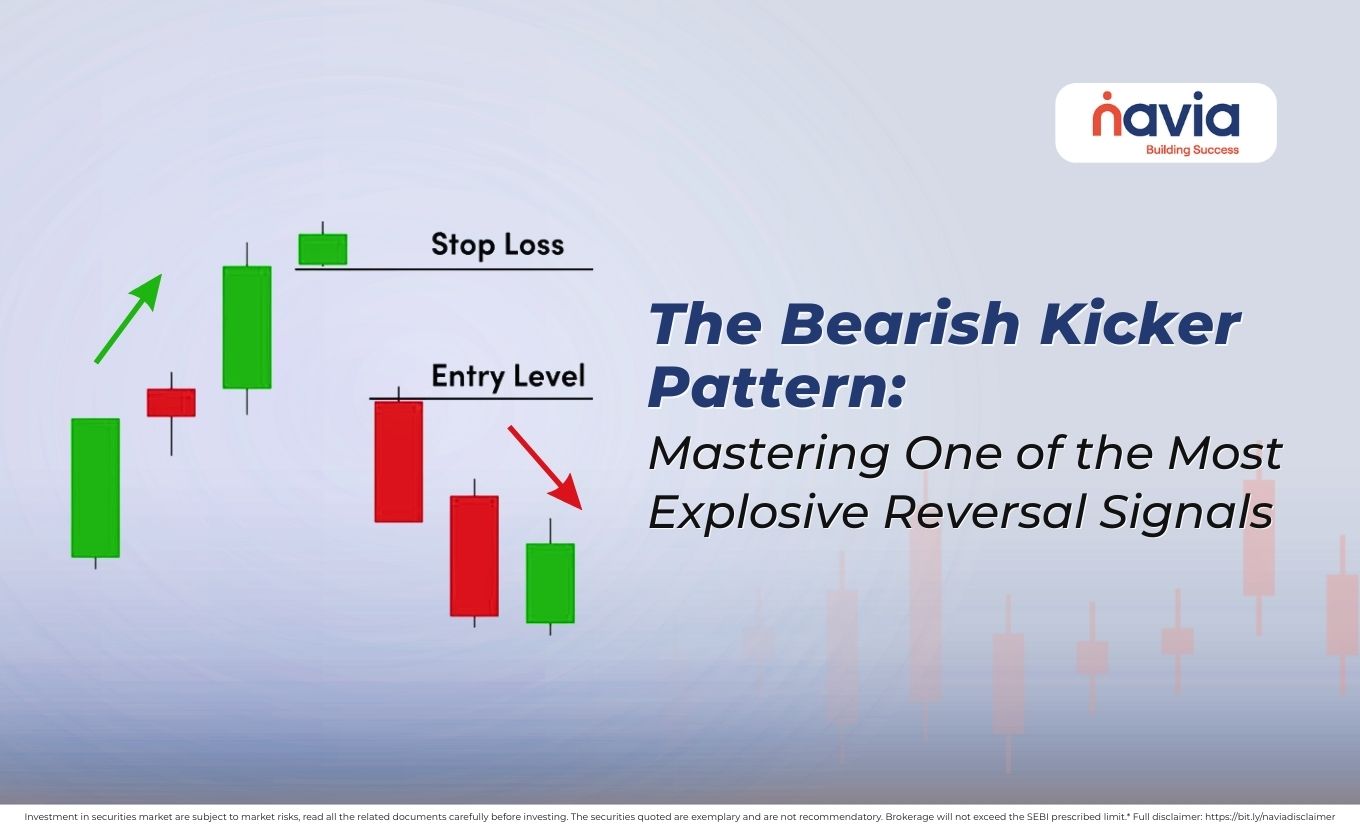
Candlestick Patterns: Bullish or bearish candlestick reversal patterns at a pivot level offer immediate confirmation for an entry.
Do professional traders use pivot points?
Yes, professional and institutional traders definitely use pivot points. They are popular on trading floors and with market makers because they are objective, fixed, and predictive.
What is the best way to use pivot points?
The best way to use pivot points is confluence zones within a well-defined strategy.
Determine Market Bias: Use the main Pivot Point (P) to establish the bullish or bearish bias for the day.
Define Strategy: Decide whether you will execute a Bounce (Reversal) Strategy or a Breakout (Continuation) Strategy.
Seek Confluence: Look for a key pivot level (R1, S1, etc.) that aligns with another technical factor, such as a moving average, a high-volume zone, or the VWAP line.
Which timeframe is best for VWAP?
It is predominantly used on intraday timeframes (1-minute, 5-minute, or 15-minute charts). These shorter charts allow the trader to see the price action and candle structure in fine detail as the price interacts with the stationary VWAP line, enabling precise entries and exits.
DISCLAIMER: Investment in securities market are subject to market risks, read all the related documents carefully before investing. The securities quoted are exemplary and are not recommendatory. Full disclaimer: https://bit.ly/naviadisclaimer.


