Navia Weekly Roundup ( NOV 25- NOV 29, 2024)
Week in the Review
The bulls strengthened their grip on Dalal Street, with benchmark indices climbing 1 percent during the volatile week ending November 29. This rise was driven by strong global cues, hopes for political stability in Maharashtra, and easing geopolitical tensions, which contributed to a decline in crude oil prices.
Indices Analysis
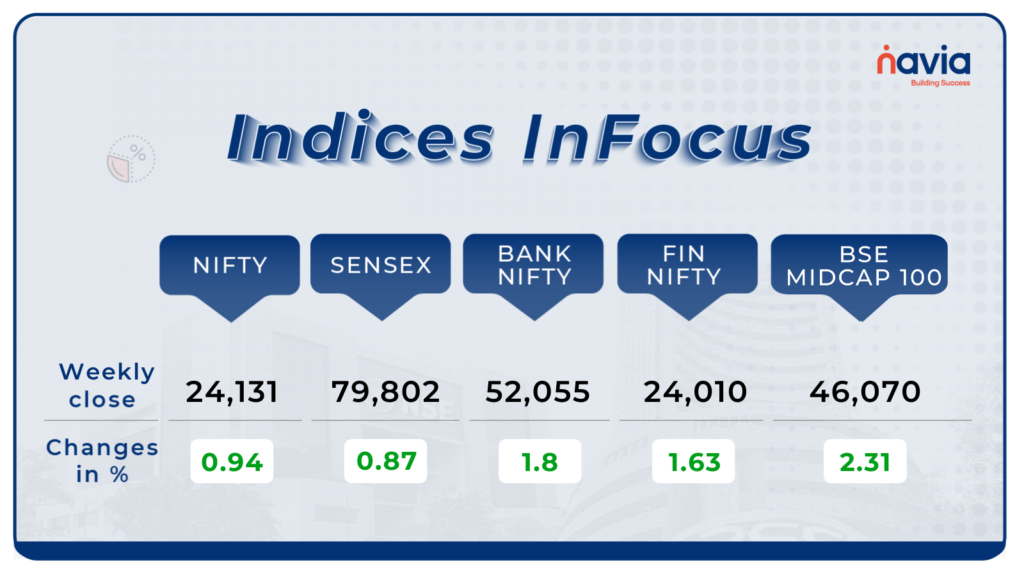
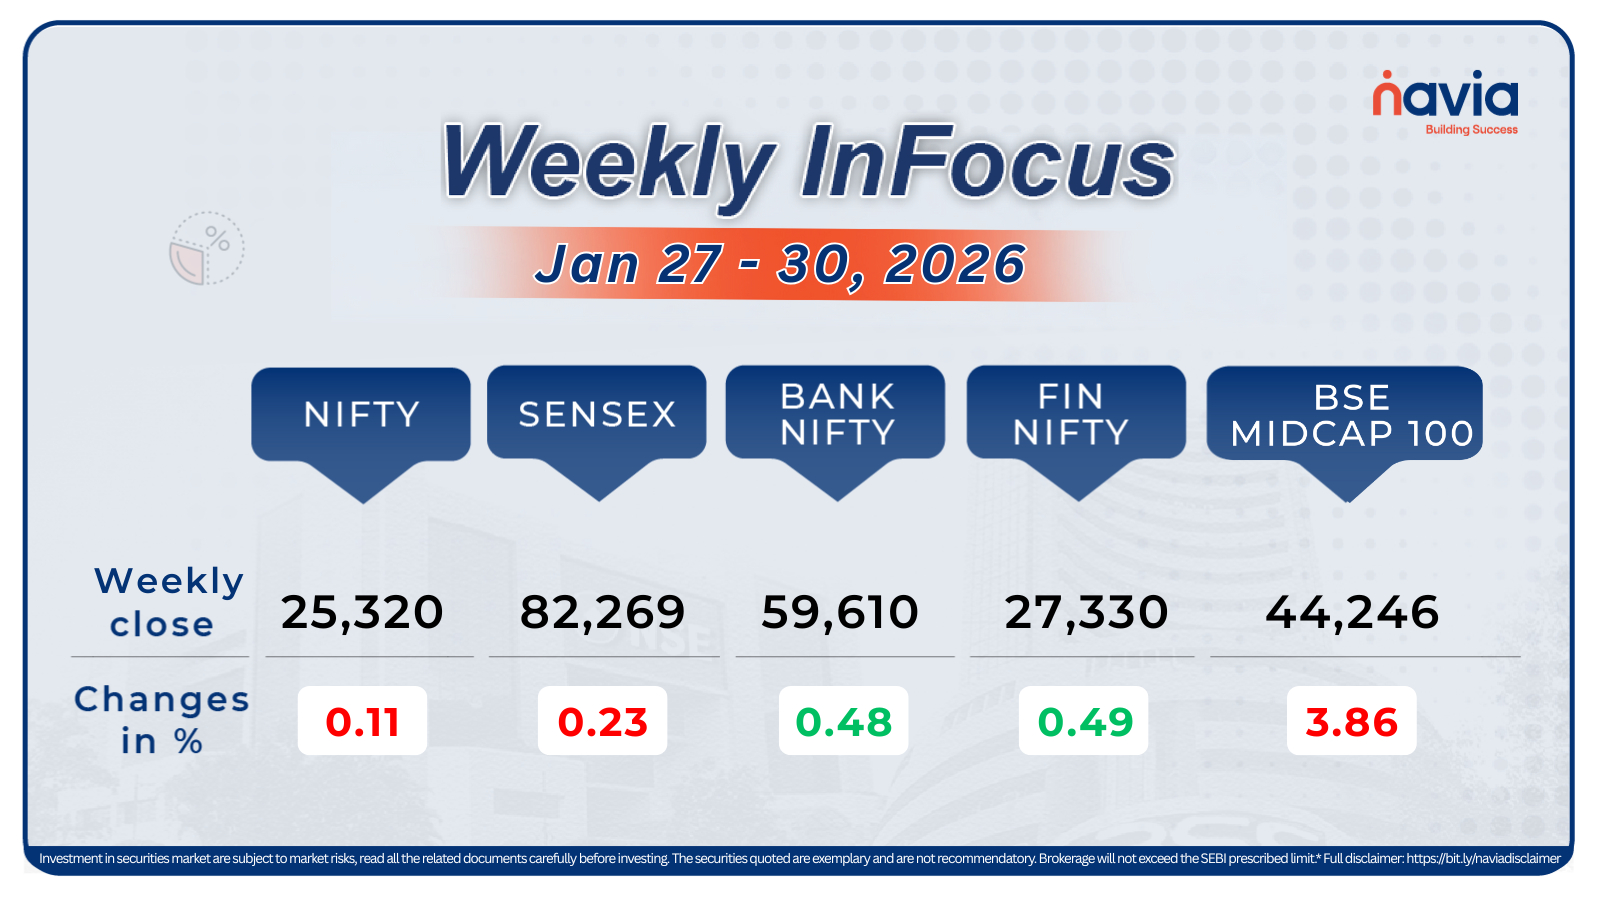
This week, BSE Sensex added 685.68 points or 0.87 percent to close at 79,802.79, while the Nifty50 index rose 223.85 points or 0.94 percent to finish at 24,131.10. However, for November, Sensex added 0.5 percent, while Nifty slipped 0.30 percent.
The BSE Small-cap index surged 5 percent with Ashapura Minechem, Man Infraconstruction, Jai Corp, Bliss GVS Pharma, Bharat Dynamics, Fedbank Financial Services, Garden Reach Shipbuilders & Engineers, Cochin Shipyard, Capacite Infraprojects rising between 20-39 percent, while JSW Holdings, ZF Commercial Vehicle Control Systems India, Nalwa Sons Investment, Oriental Aromatics, Raghav Productivity Enhancers shed between 10-16 percent.
Interactive Zone!
Test your knowledge with our Markets Quiz! React to the options and see how your answer stacks up against others. Ready to take a guess?
Sector Spotlight
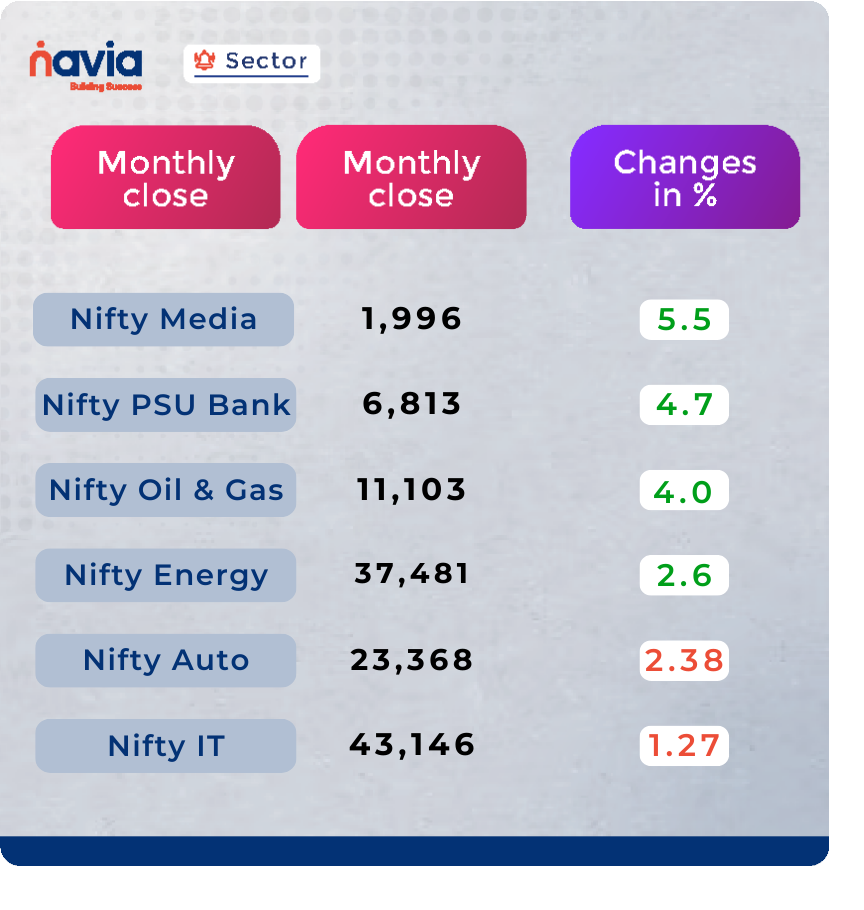
On the sectoral front, Nifty Media index added 5.5 percent, Nifty PSU Bank index rose 4.7 percent, Nifty Oil & Gas index up 4 percent, Nifty Energy index added 2.6 percent. On the other hand, Nifty Auto and Information Technology indices shed arount 2 percent each.
Top Gainers and Losers
Currency Chronicles
USD/INR:
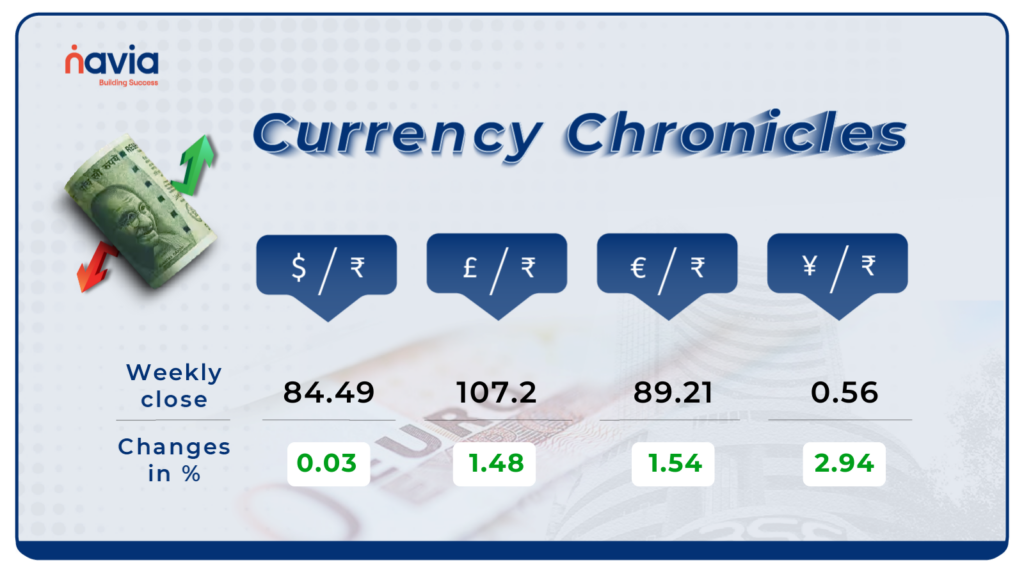
In this week, the Indian rupee ended marginally lower at 84.49 per dollar on November 29 against the November 22 closing of 84.45.
EUR/INR:
The euro gained momentum this week, rising by 1.54% to end at ₹89.21. Sentiment in the EUR/INR market has turned bullish, reflecting renewed strength in the euro.
JPY/INR:
The Japanese yen gained 2.94% this week, closing at ₹0.56. While sentiment remains neutral, the yen’s strong uptick signals renewed interest amid global currency shifts.
Stay tuned for more currency insights next week!
Commodity Corner
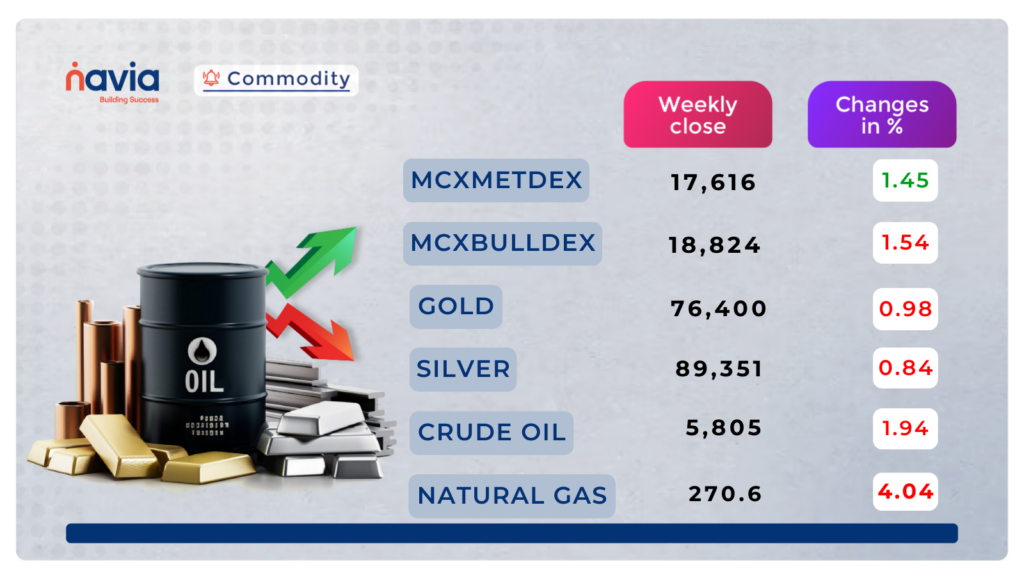
Crude oil is currently in a period of uncertainty, forming a symmetrical Triangle pattern. While the last session ended up bullish inside the channel. The market’s future movement will depend on whether it breaks above the resistance or below the support.
If the price can break above the resistance level of 5880, it may rise to 5960 and 6040. However, if the price breaks and trades below the support level of 5750, it could signal a downward trend once again, potentially leading to a decline to 5670 or even 5590.
Gold has been falling recently, forming a Rounded Top pattern on the daily chart. Yesterday, the market ended slightly bullish once again. The market’s future movement will depend on whether it breaks above the resistance or below the support.
If the market can break above the current resistance level of 76,000, it may rise to 76,350 and 76,700 levels. However, if the price manages to break below the near support level of 75,100, it could signal a downward trend, potentially leading to a decline to 74,750 and 74,350 levels.
Natural gas has been trending uncertainly, where the last sessions ended bullish, inside the Ascending broadening wedge pattern on the daily interval long-term chart. The future direction of the market is uncertain at this point and will depend on how it reacts to these key support and resistance levels. If the market break and trades above the resistance level of 279, it could further rise to 285 and 292 levels. However, if the price breaks below the support level of 270, it could revive the downward trend, potentially leading to a decline to 264 and 258.
Silver had been in a range, as forming a Rounded Top Pattern. The last session ended up slightly bullish on a gap down, yet indicating some uncertainties moving forward. The market’s future movement will depend on whether it breaks above the resistance or below the support. If the market breaks above the current resistance level of 88,500, it may continue to rise to 89,700 and 90,800 levels.
However, if the price manages to break below the support level of 86,900, it could start to decline once again, potentially leading to 85,700 and 84,500 levels.
Do you have a question? Ask here and we’ll publish the information in the coming weeks.
Blogs of the Week!

Invitation to Join Navia’s new Stock Market APP Beta Testing Program and Shape the Future of Trading!
Be part of Navia’s exciting Beta Testing Program and help shape the future of trading! 🚀 Dive into our cutting-edge Stock Market APP, gain early access to innovative features, and make your mark by sharing valuable feedback. Influence the final product, connect with fellow traders, and unlock exclusive rewards. Ready to redefine your trading journey? Let’s get started!
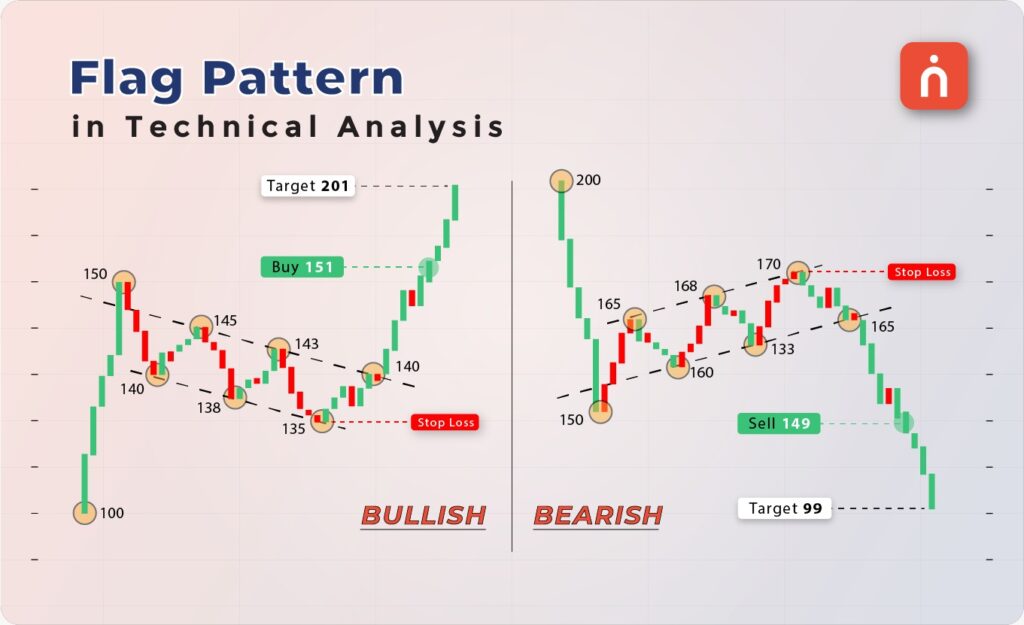
Understanding the Flag Pattern in Technical Analysis
The Flag Pattern is a powerful continuation pattern, signaling strong breakouts after brief consolidation. Learn to spot bullish and bearish flags, set effective entry points, and confirm with volume trends. Master this pattern to trade trends confidently!
N Coins Rewards

Refer your Friends & Family and GET 500 N Coins.
Do You Find This Interesting?


