Navia Weekly Roundup ( NOV 18- NOV 22, 2024)
Week in the Review
The bulls made a strong comeback in the week ending November 22, with Indian benchmarks breaking a two-week losing streak to close with nearly 2% gains, despite fresh geopolitical tensions and continued FII selling.
Indices Analysis
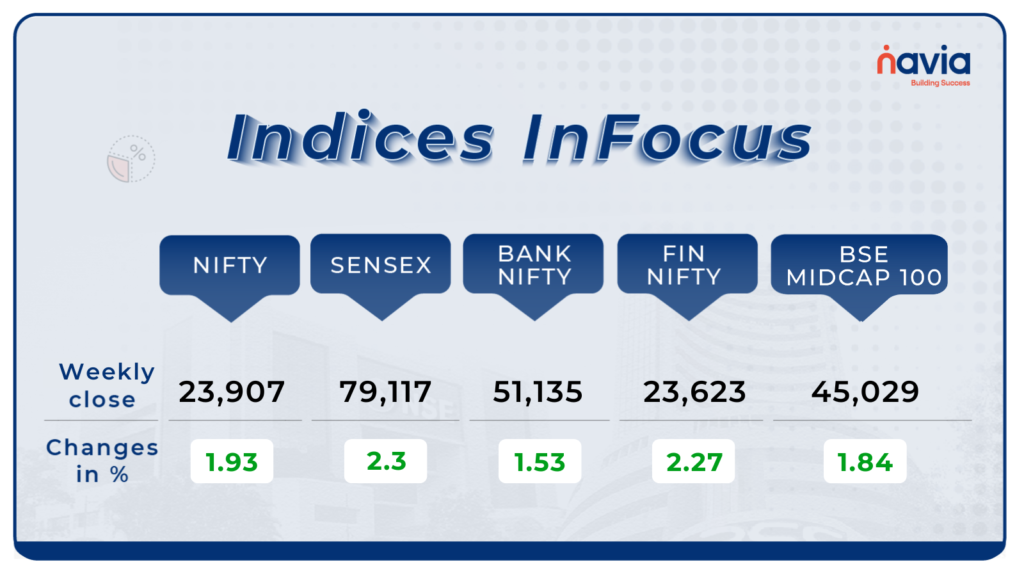
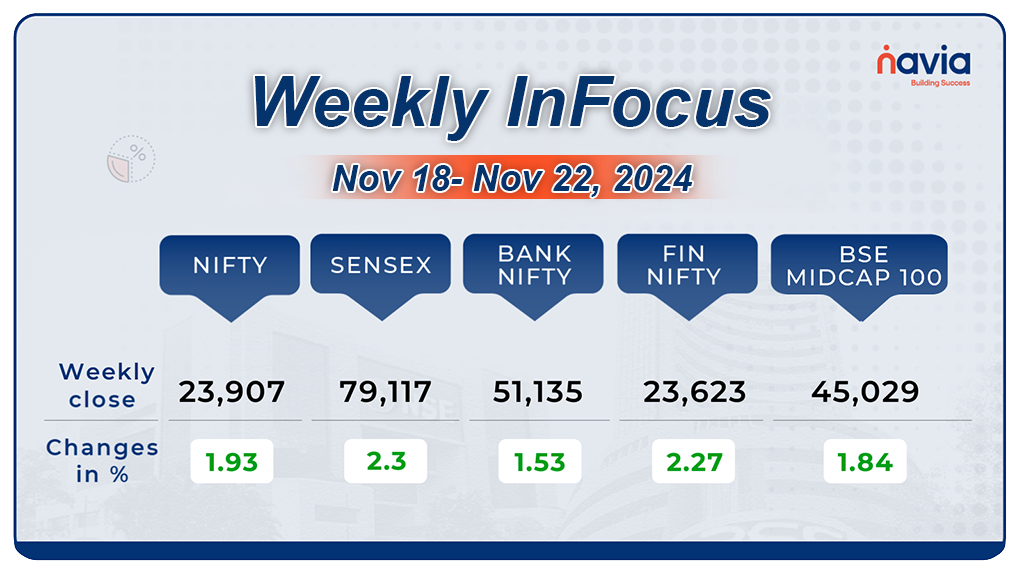
This week, BSE Sensex rose 1,536.8 points or 2.3 percent to end at 79,117, while the Nifty50 index added 374.6 points or 1.93 percent to close at 23,907.30.
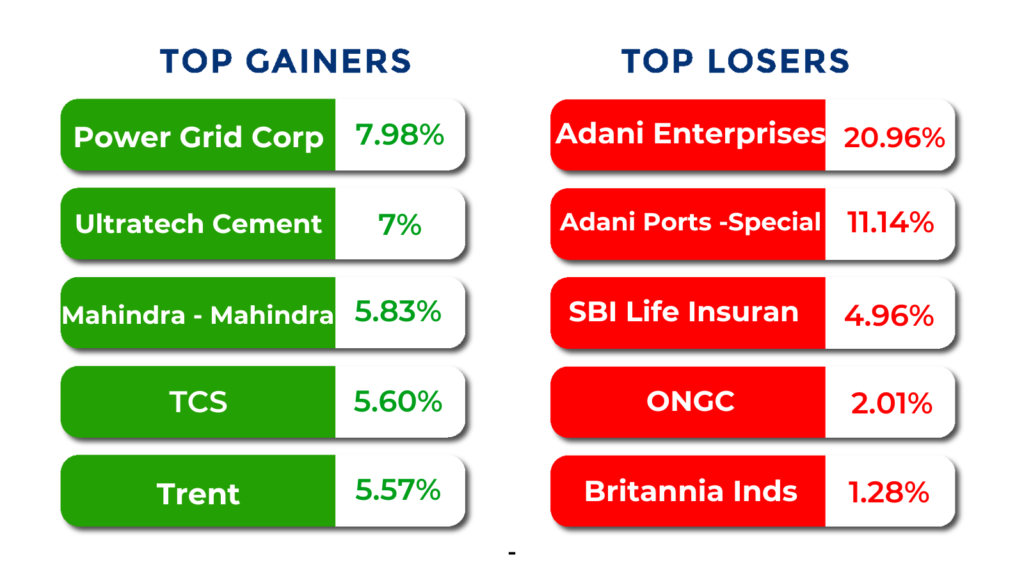
The BSE Large-cap Index added 1.7 percent led by Power Grid Corporation of India, Mahindra and Mahindra, Varun Beverages, Interglobe Aviation, UltraTech Cement, DLF, Power Finance Corporation, Polycab India. On the other hand, Adani Green Energy, Adani Energy Solutions, Adani Enterprises, Adani Power, Adani Total Gas, Adani Ports and Special Economic Zone fell 10-29 percent.
Interactive Zone!
Test your knowledge with our Markets Quiz! React to the options and see how your answer stacks up against others. Ready to take a guess?
Sector Spotlight
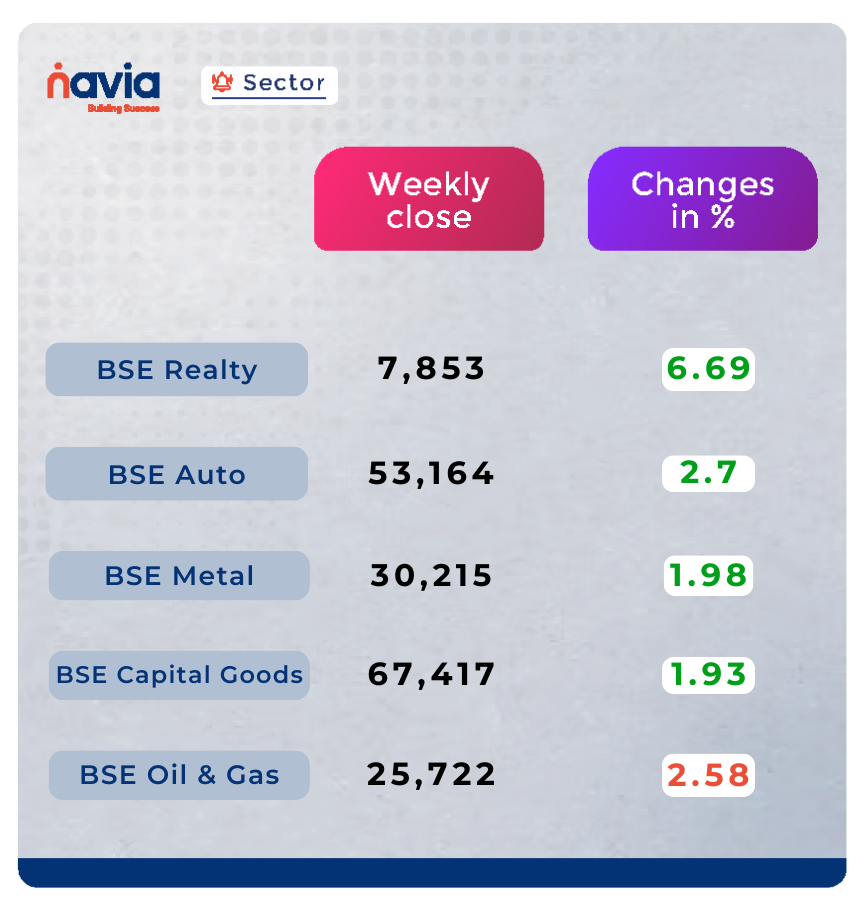
On the sectoral front, BSE Realty index rose more than 6 percent, BSE Auto, Metal, Capital Goods indices up 2 percent each. However, BSE Oil & Gas index fell nearly 2 percent.
Top Gainers and Losers
Currency Chronicles
USD/INR:
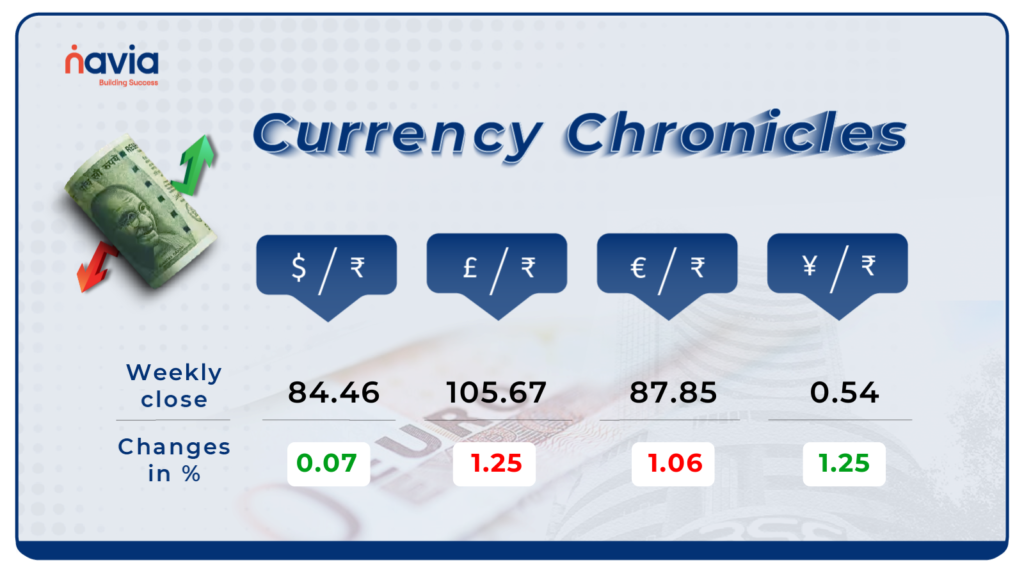
The Indian rupee hit a fresh record low of ₹84.50 against the U.S. dollar but managed to recover slightly, closing at ₹84.45 on November 22, down by 5 paise from the previous week’s ₹84.40.
EUR/INR:
The euro slipped further, declining by 1.06% for the week to end at ₹87.85. Sentiment in the EUR/INR market remains bearish, reflecting continued weakness in the euro.
JPY/INR:
The Japanese yen gained 1.25% this week, closing at ₹0.543767. While sentiment is neutral, the yen’s uptick hints at renewed interest amid global currency shifts.
Stay tuned for more currency insights next week!
Commodity Corner
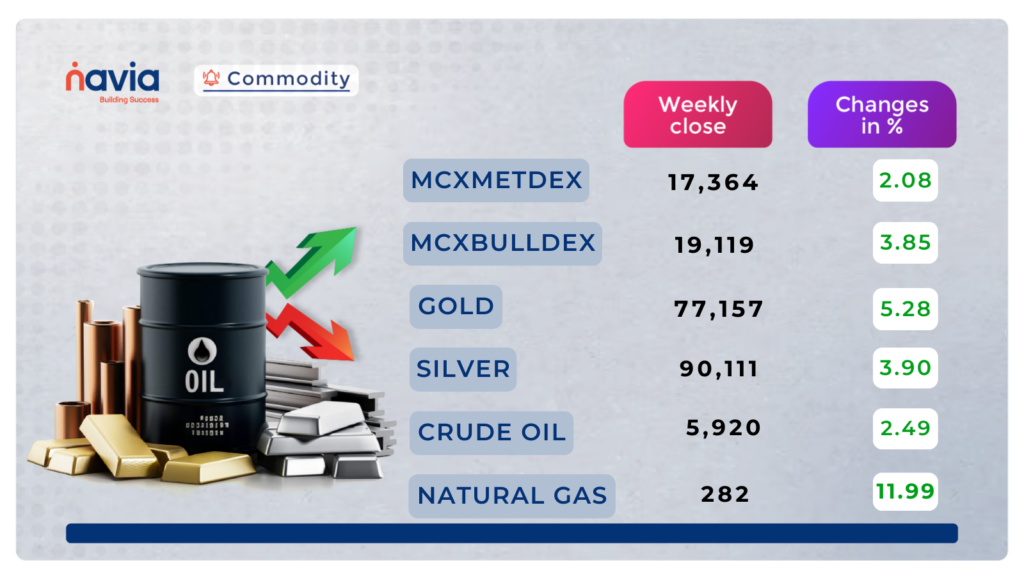
Crude oil is currently in a period of uncertainty, forming a descending Triangle pattern. While the last session ended up bullish inside the channel. The market’s future movement will depend on whether it breaks above the resistance or below the support.
If the price can break above the resistance level of 5940, it may rise to 6020 and 6080. However, if the price breaks and trades below the support level of 5820, it could signal a downward trend once again, potentially leading to a decline to 5740 or even 5690.
Gold has been falling recently, forming an Inverted Cup and Handle pattern on the daily chart. Yesterday, the market ended bullish once again. The market’s future movement will depend on whether it breaks above the resistance or below the support.
If the market can break above the current resistance level of 76,850, it may rise to 77,200 and 77,600 levels. However, if the price manages to break below the support level of 76,200, it could signal a downward trend, potentially leading to a decline to 75,850 and 75,400 levels.
Natural gas has been trending uncertainly, where the last sessions ended bullish once again, forming a Rising channel on the daily interval long-term chart. The future direction of the market is uncertain at this point and will depend on how it reacts to these key support and resistance levels. If the market breaks above the resistance level of 279, it could further rise to 284 and 290 levels. However, if the price breaks below the support level of 271, it could revive the downward trend, potentially leading to a decline to 266 and 260.
Silver had started rising, as forming a Descending Broadening Wedge Pattern. The last session ended up sideways, indicating some uncertainties moving forward. The market’s future movement will depend on whether it breaks above the resistance or below the support. If the market breaks below the current support level of 89,500, it may continue to decline to 88,400 and 87,100 levels. However, if the price manages to break above the resistance level of 91,500, it could start to rise once again, potentially leading to 92,500 and 93,800 levels.
Do you have a question? Ask here and we’ll publish the information in the coming weeks.
Blogs of the Week!
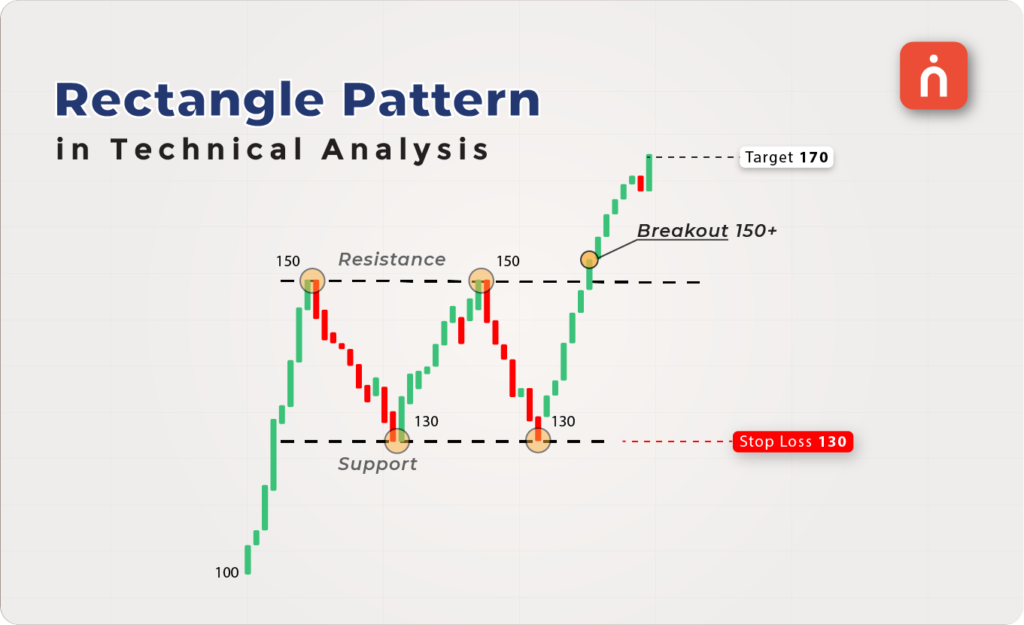
Understanding the Rectangle Pattern in Technical Analysis
The Rectangle Pattern is a must-know tool for traders, offering reliable breakout signals in both bullish and bearish markets. Master the art of identifying this pattern, setting entry points, stop-losses, and targets to capture profits confidently. With its simple identification process and clear strategies, the Rectangle Pattern is your key to smarter trading decisions.

Debunking Stock Market Myths: Separating Fact from Fiction
The stock market is full of potential, but it’s also surrounded by myths that can mislead investors. From “Stock prices always go up” to “Investing is like gambling,” these misconceptions can hinder your success. In our blog, we tackle 10 common myths, reveal the facts, and share proven strategies for smarter investing.
N Coins Rewards

Refer your Friends & Family and GET 500 N Coins.
Do You Find This Interesting?


