Navia Weekly Roundup (May 05 – May 09, 2025)
Week in the Review
The ongoing border tensions between India and Pakistan dragged the Indian benchmark indices by more than a percent in the week ended May 9, breaking 3-week gaining streak ignoring other positive global cues, including US-UK trade talk, US-Chine trade negotiation, ECB rate cut, FII buying and Free Trade Agreement (FTA) between UK-India.
Indices Analysis
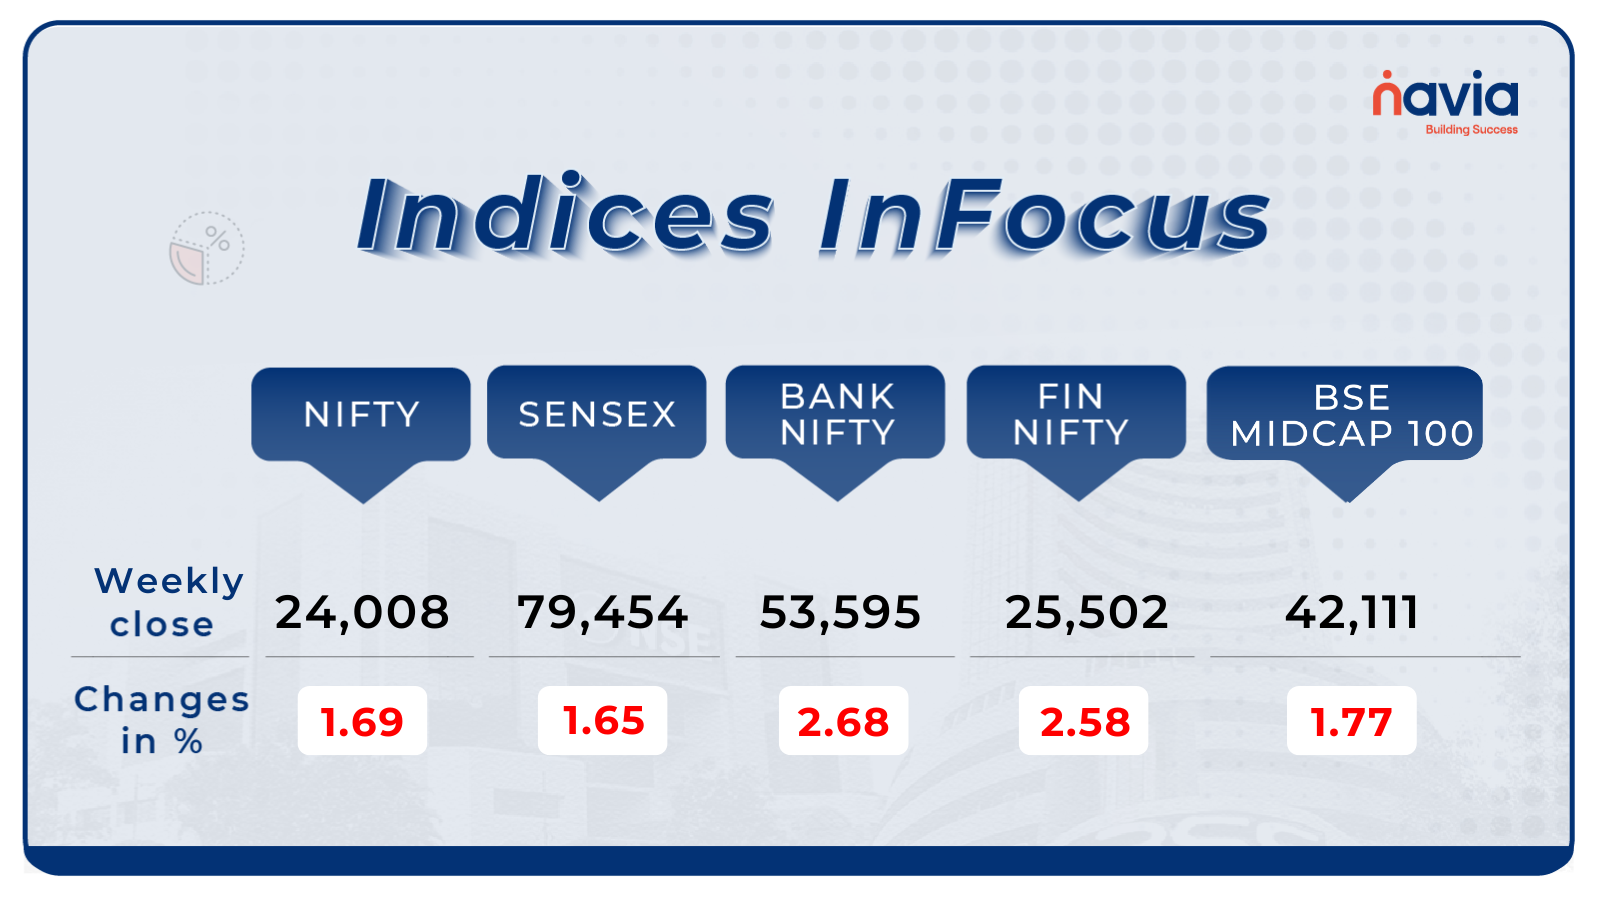
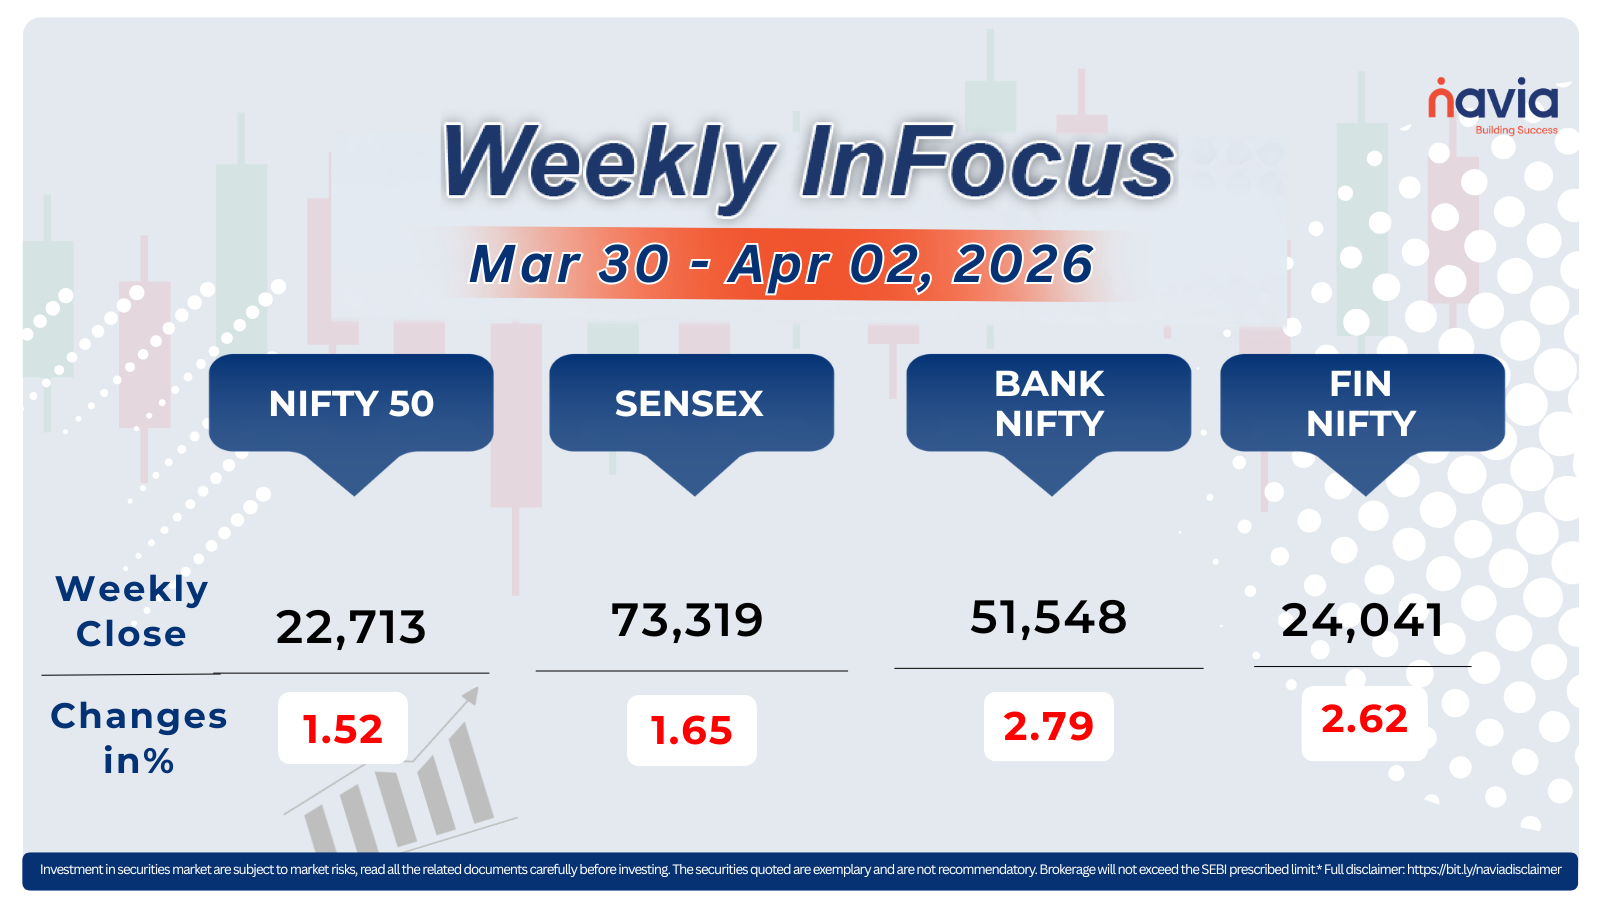
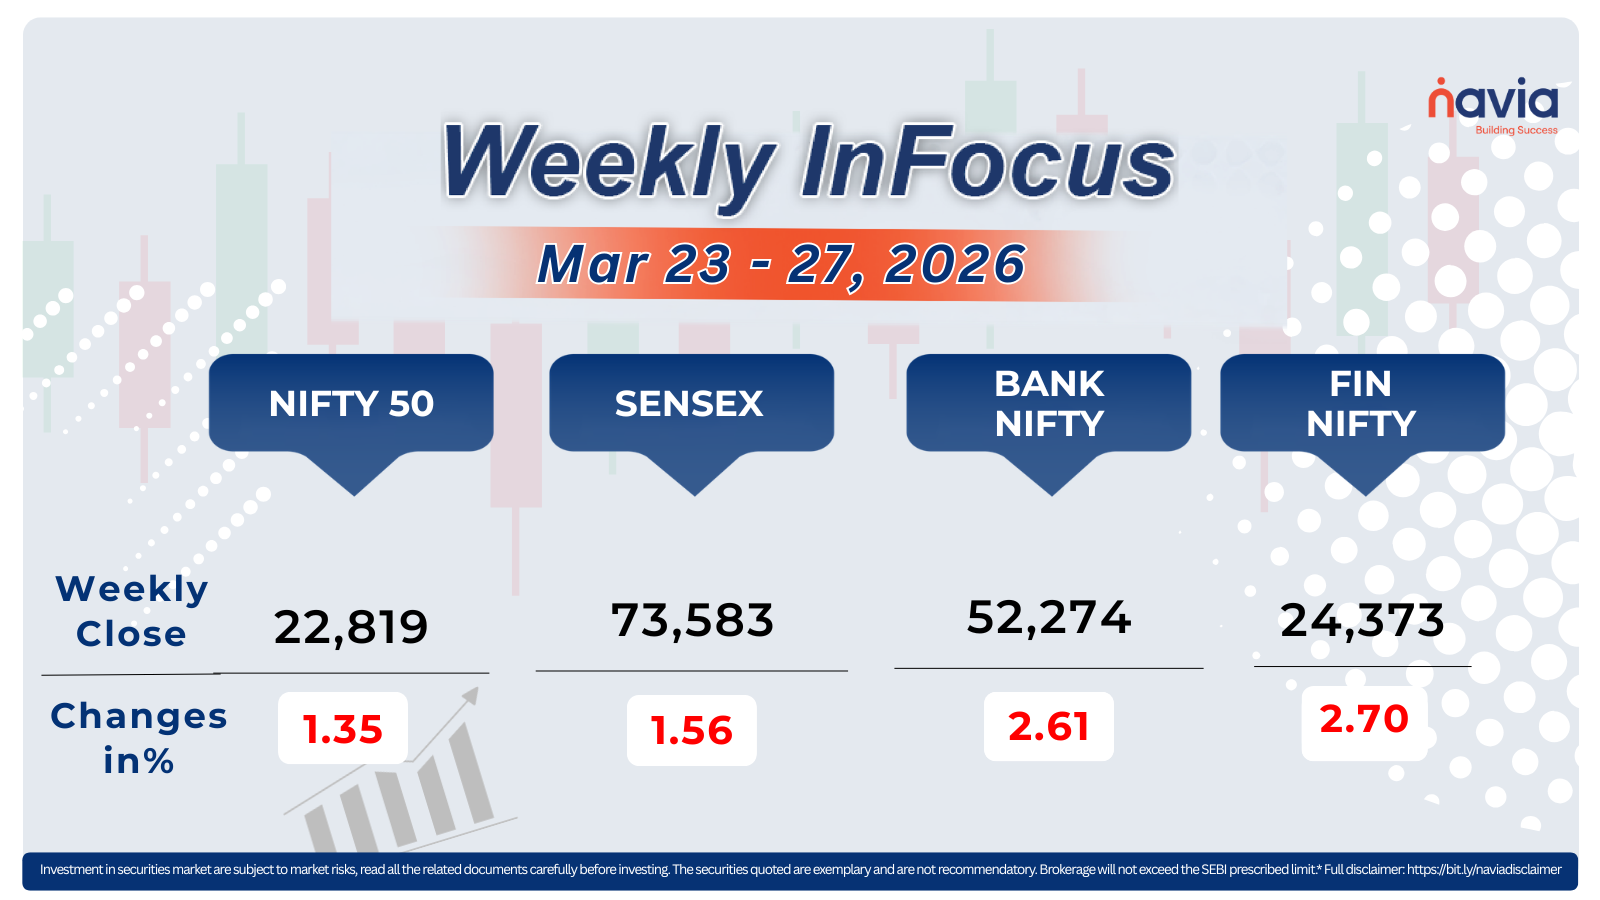
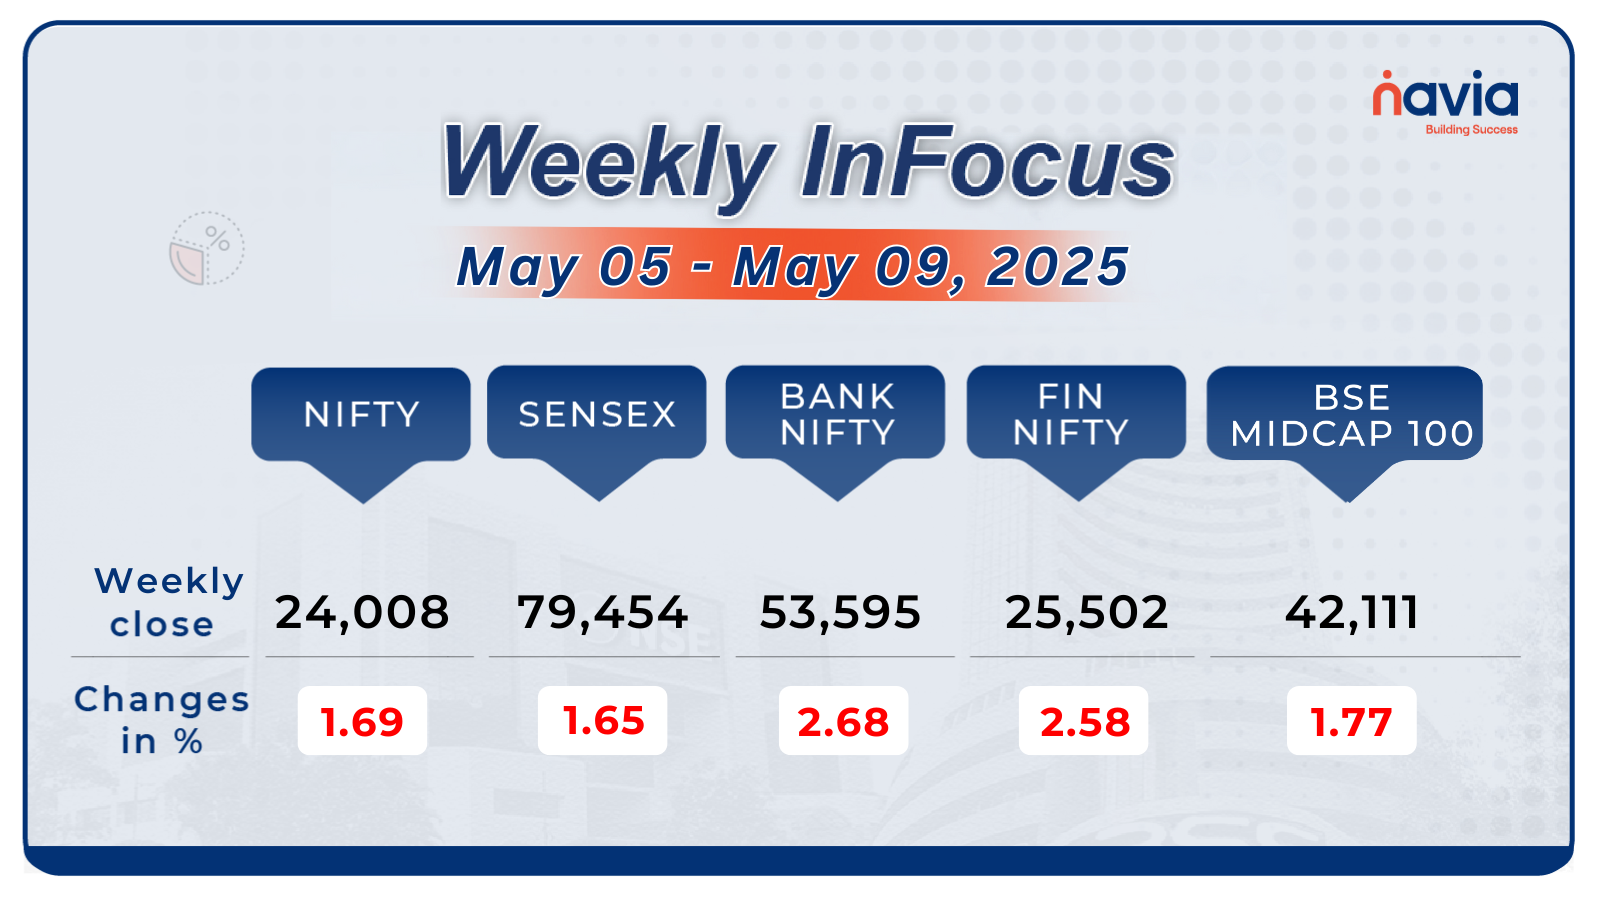
For the week, the BSE Sensex index declined 1.65 percent to close at 79,454.47, and Nifty50 shed 1.69 percent to close at 24,008.
The BSE Large-cap Index declined 1.5 percent dragged by Bank Of Baroda, Adani Energy Solutions, REC, DLF, Indian Overseas Bank, while gainers were Tata Motors, Polycab India, Titan Company, Samvardhana Motherson International.
The BSE Small-cap index shed 1.3 percent with KSolves India, Gensol Engineering, KR Rail Engineering, Jindal Saw, Century Enka, Nacl Industries falling between 15-27 percent, while Timex Group India, KPR Mill, Faze Three, Transpek Industry, Ideaforge Technology, R R Kabel, CCL Products India, S P Apparels rising between 20-36 percent.
Interactive Zone!
Test your knowledge with our Markets Quiz! React to the options and see how your answer stacks up against others. Ready to take a guess?
Sector Spotlight
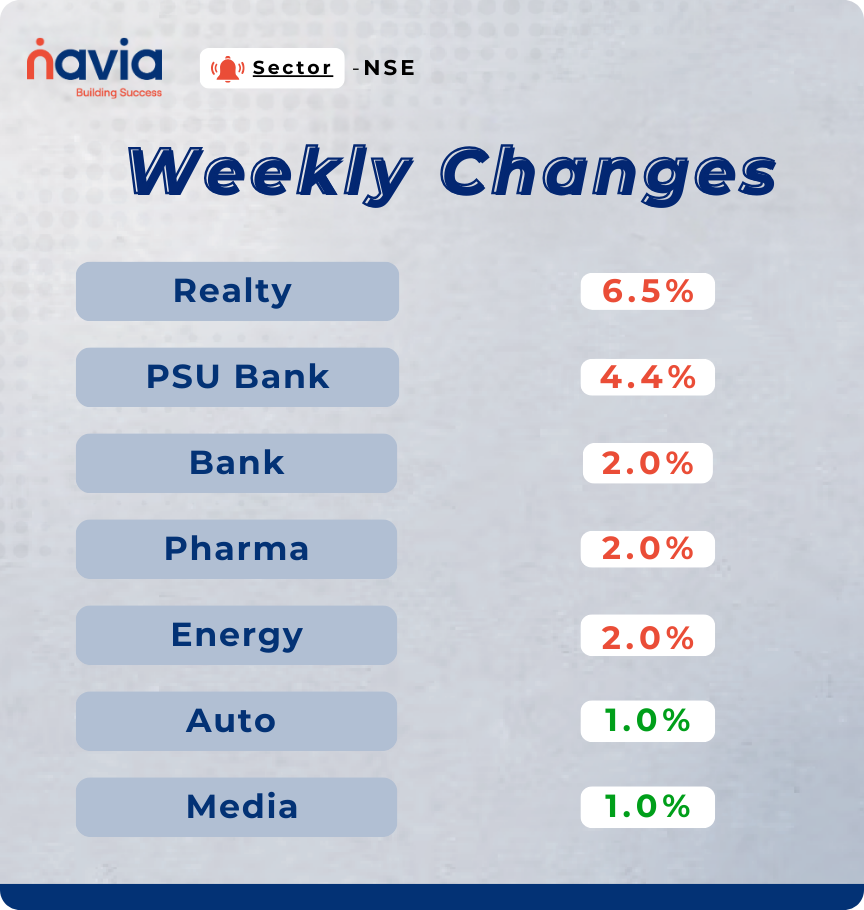
Among sectors, Nifty Realty index plunged 6.5 percent, Nifty PSU Bank index shed 4.4 percent, Nifty Bank, Pharma, Energy down more than 2 percent each. On the other hand, Nifty Auto and Media rose more than 1 percent each.
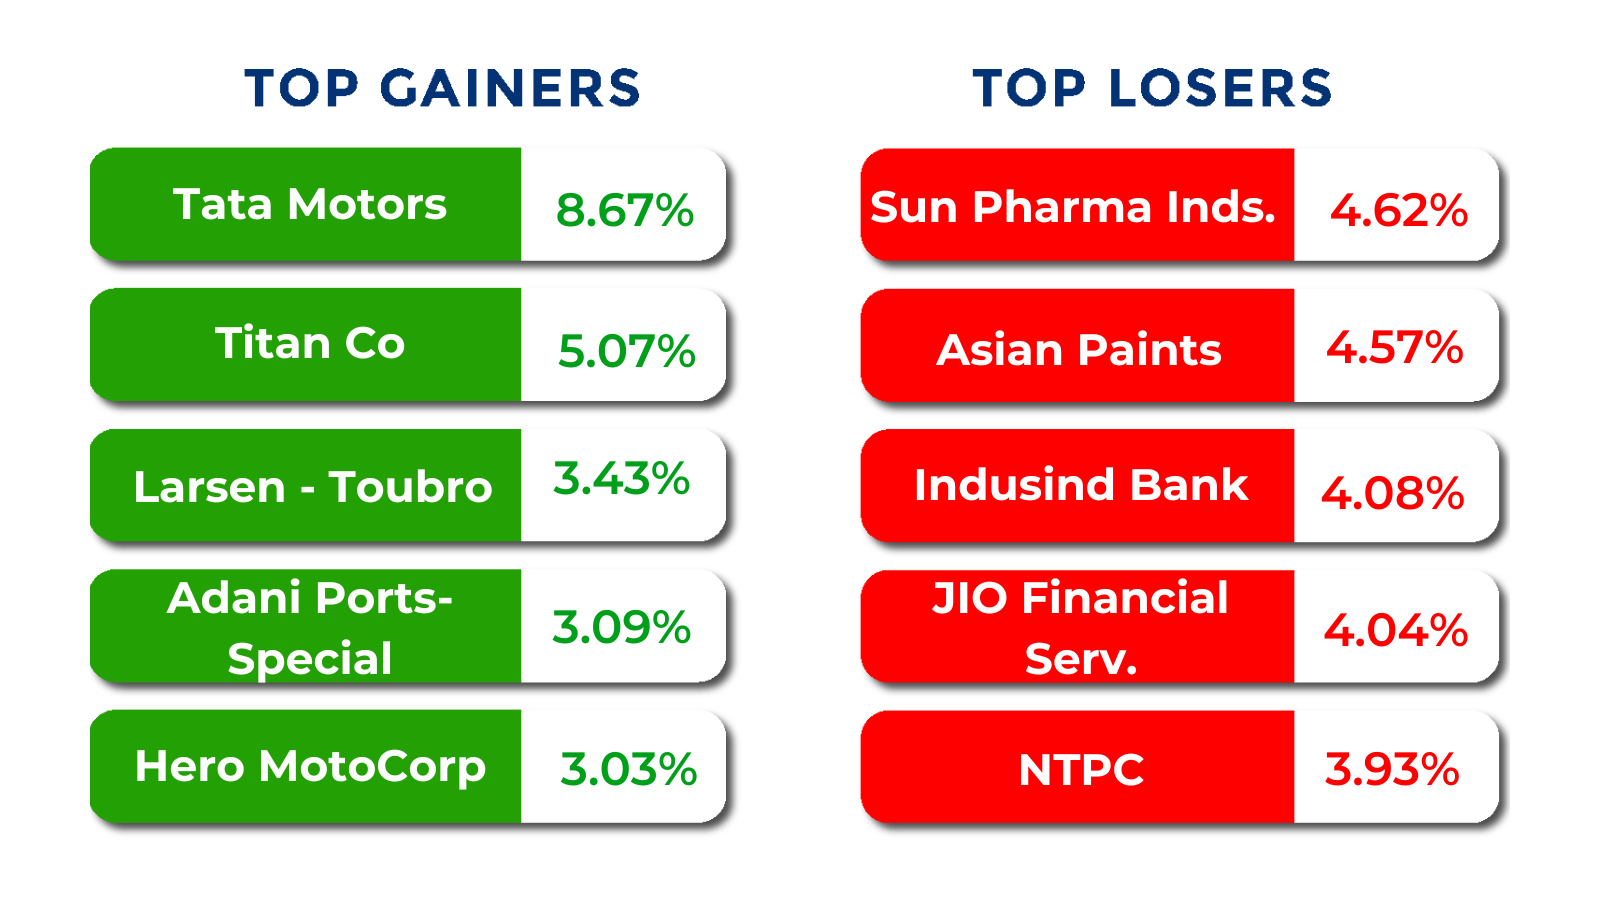
Top Gainers and Losers
Currency Chronicles
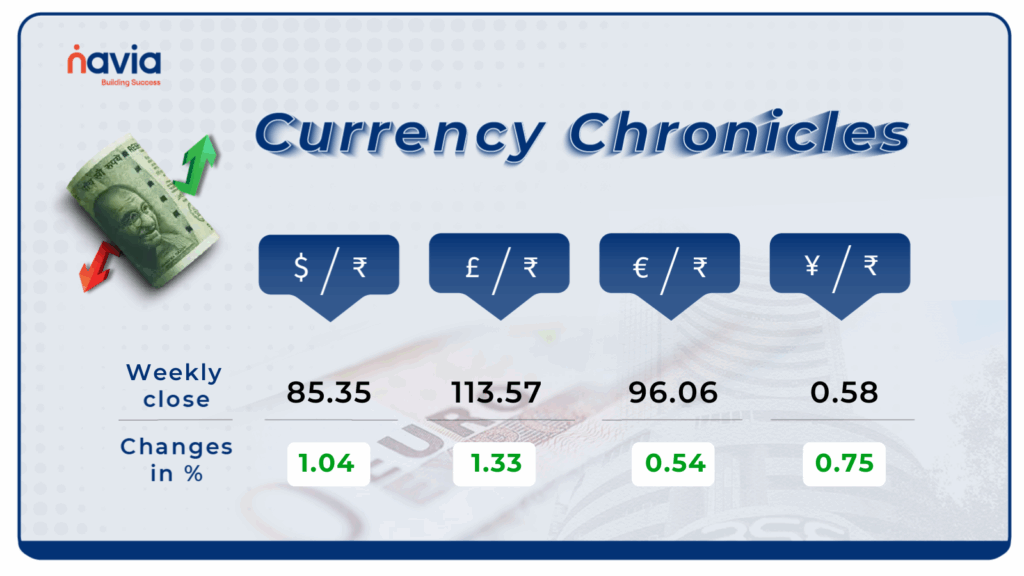
USD/INR:
The USD/INR rate closed at ₹85.35 per dollar, gaining 1.04% during the week, reflecting a bullish market sentiment.
EUR/INR:
The EUR/INR rate closed at ₹96.06 per euro, gaining 0.54% during the week, reflecting a bullish market sentiment.
JPY/INR:
The JPY/INR rate closed at ₹0.58 per yen, gaining 0.75% during the week, reflecting a bullish market sentiment.
Stay tuned for more currency insights next week!
Commodity Corner
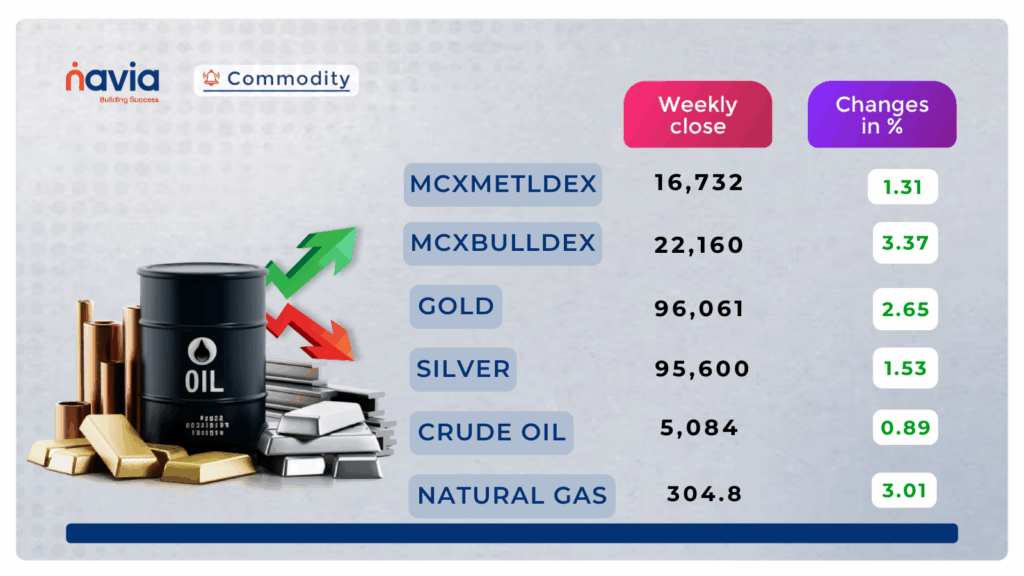
Crude Oil formed a descending wedge pattern. In the last session, it closed at 5,084. It has broken a major resistance range. Holding above this level could lead to further higher levels. A resistance can be faced at the 5315–5320 range.Further intraday upside momentum is likely above 5175, while a breakdown below 5135 could trigger additional selling pressure.
In the last session, Gold closed at 96,061. Technically, Gold holds in a bullish territory. Trading above 96,000 could add further positiveness to Gold. It is currently trading in an ascending channel in the wider frame and may face resistance near 98,300. For intraday traders, a move above 96,700 may indicate upside potential, while a dip below 95,830 could trigger further downside pressure.
Natural Gas experienced significant volatility in the last session. It closed at 304.8. Another intraday move is likely above 309.8, while downside pressure could emerge below 303.4. It is currently trading in an ascending channel as shown in the chart. Above 318, a strong momentum can be expected. Natural Gas needs a close above 318 for a confirmed uptrend. However, a close below 287 could signal a further fall in prices.
Do you have a question? Ask here and we’ll publish the information in the coming weeks.
Blogs of the Week!

The Rise of ETFs in India: What Investors Should Know?
ETFs in India are rising fast due to their low cost, liquidity, and diversification benefits. With growing investor interest, they’re becoming a preferred tool for smart, passive investing.

The Men’s Underwear Index: A Silent Indicator of Economic Strain
During financial downturns, men often delay buying new underwear—a quiet but telling sign of tightened budgets. This odd yet insightful indicator, coined by Alan Greenspan, reveals how deeply economic stress impacts even the most personal spending choices.
N Coins Rewards

Refer your Friends & Family and GET 500 N Coins.
Do You Find This Interesting?