Navia Weekly Roundup ( Mar 3 – 7, 2025)
Week in the Review
The Indian market snapped three week losing streak to record biggest weekly gain in 2025 in the week ended March 7 despite volatile global markets due to uncertainty around US trade policy.
Indices Analysis
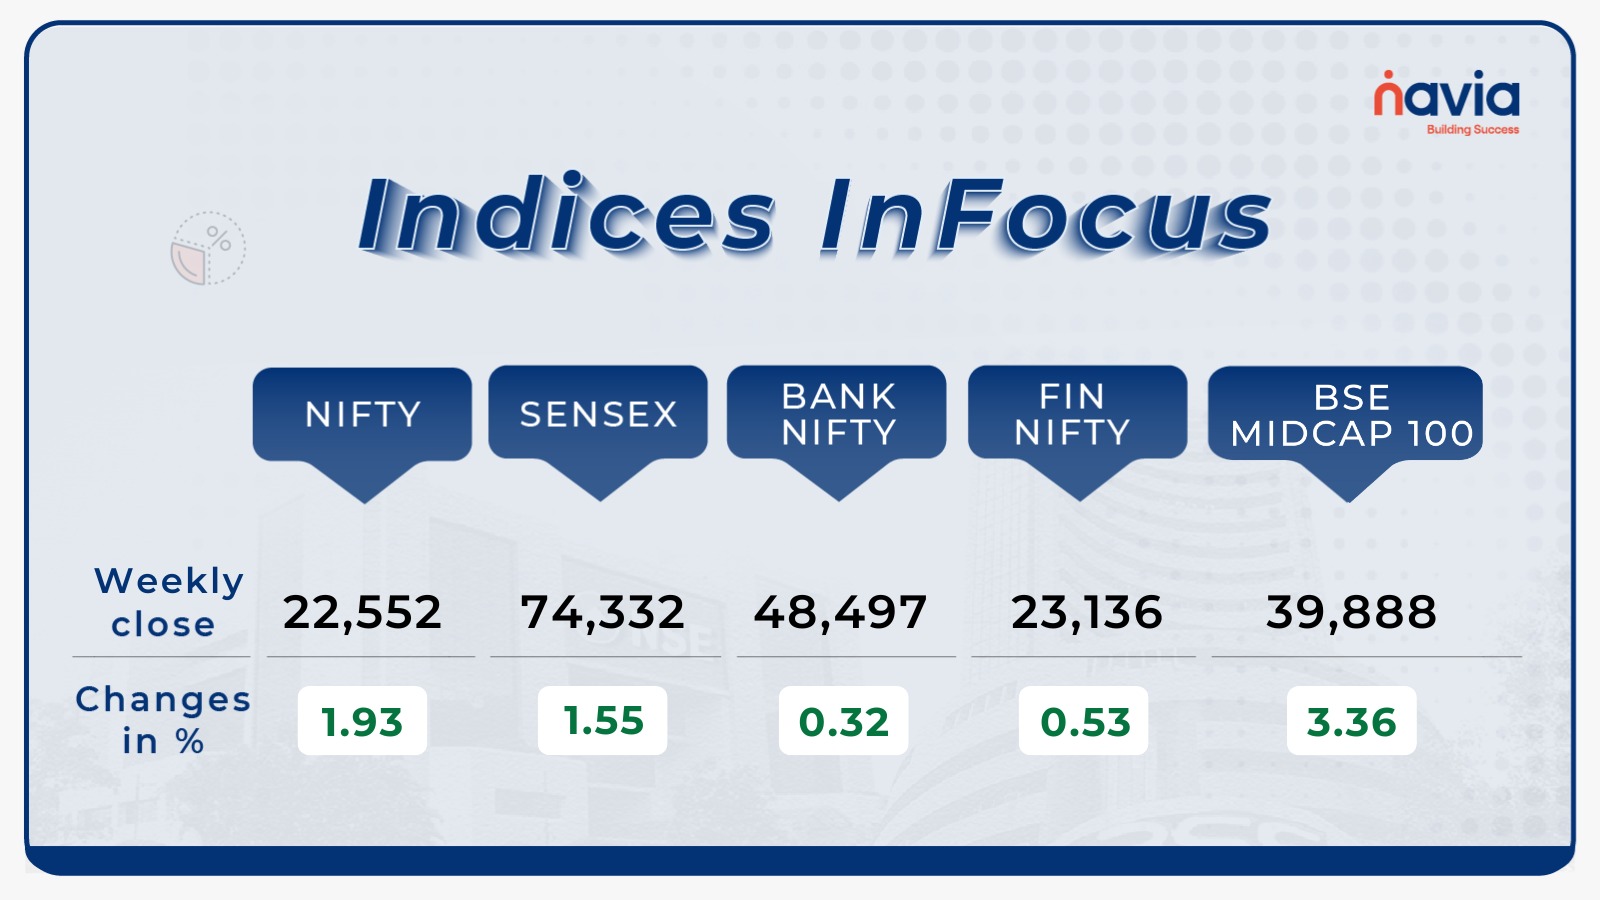
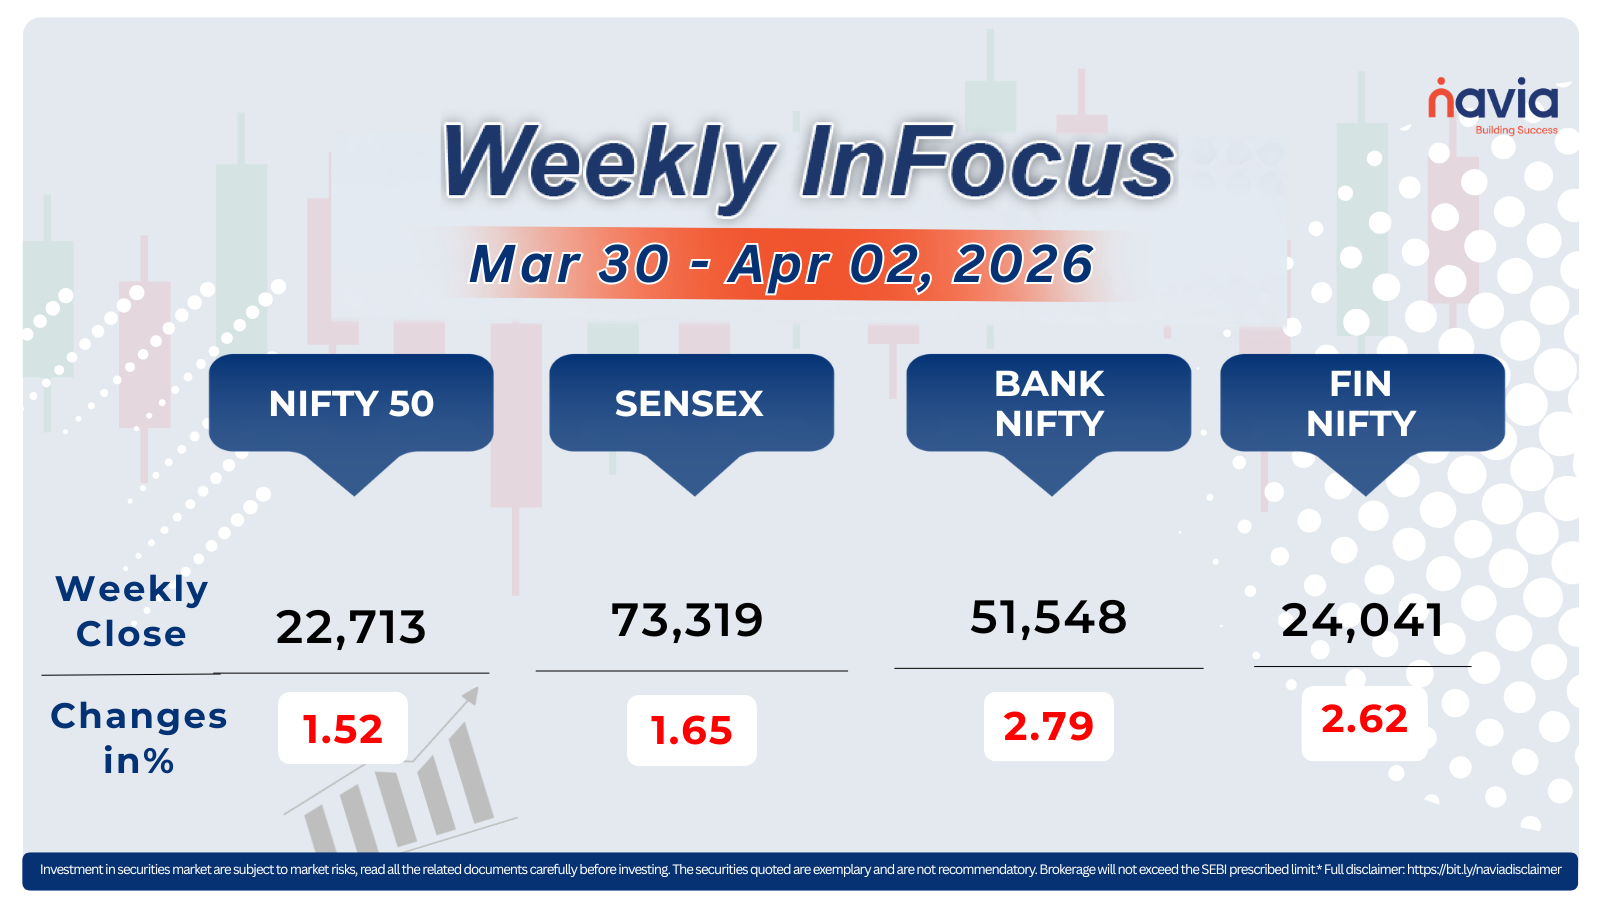
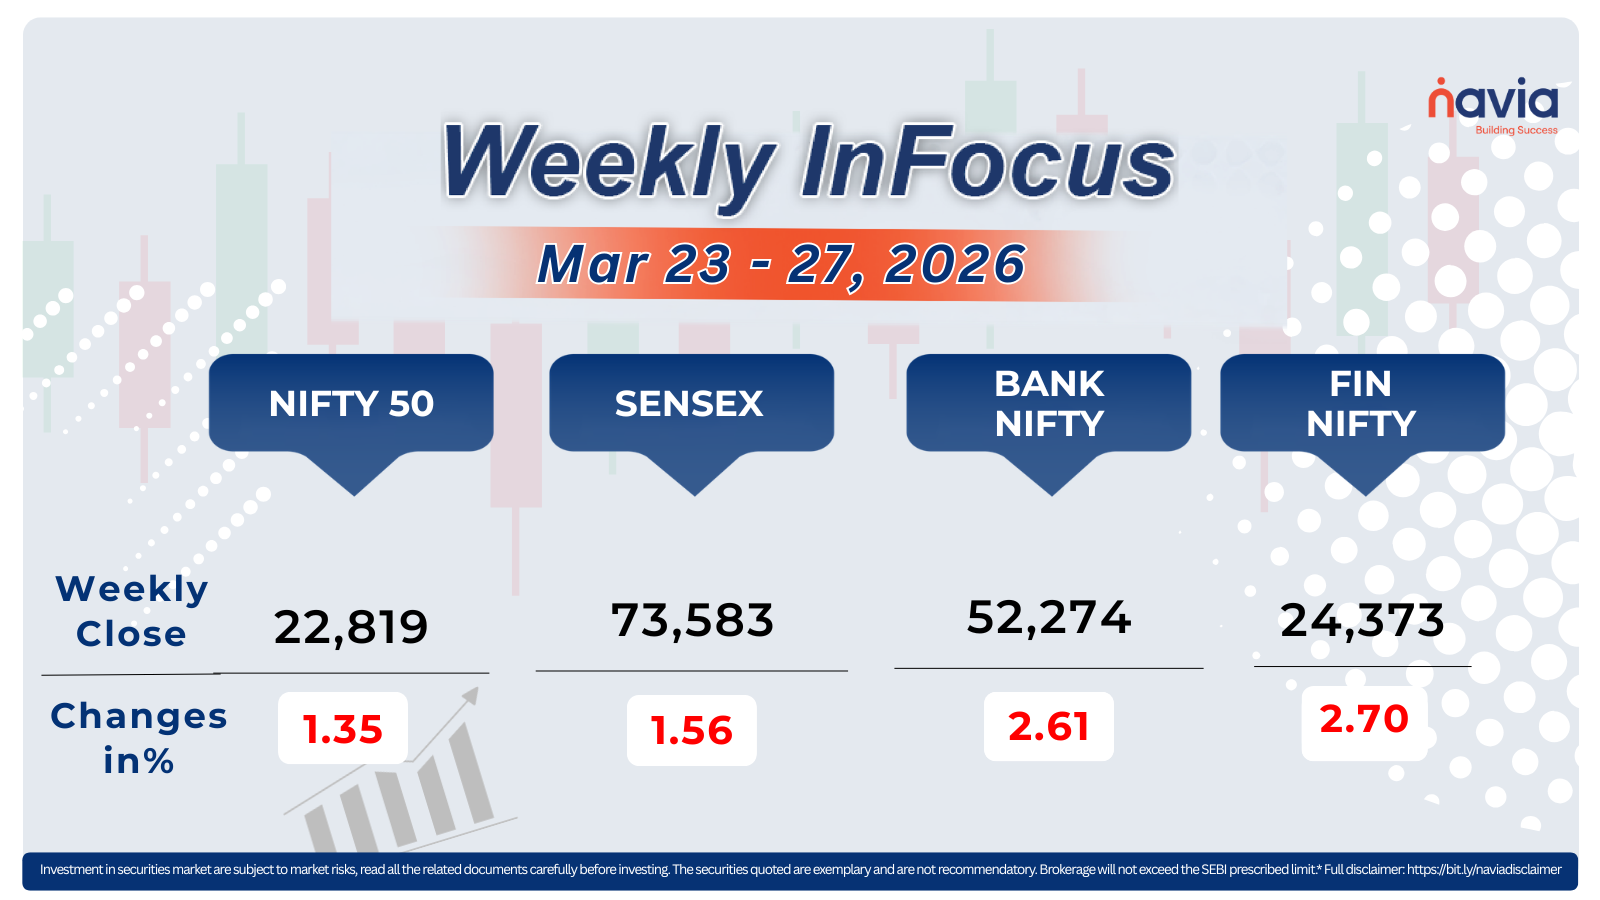
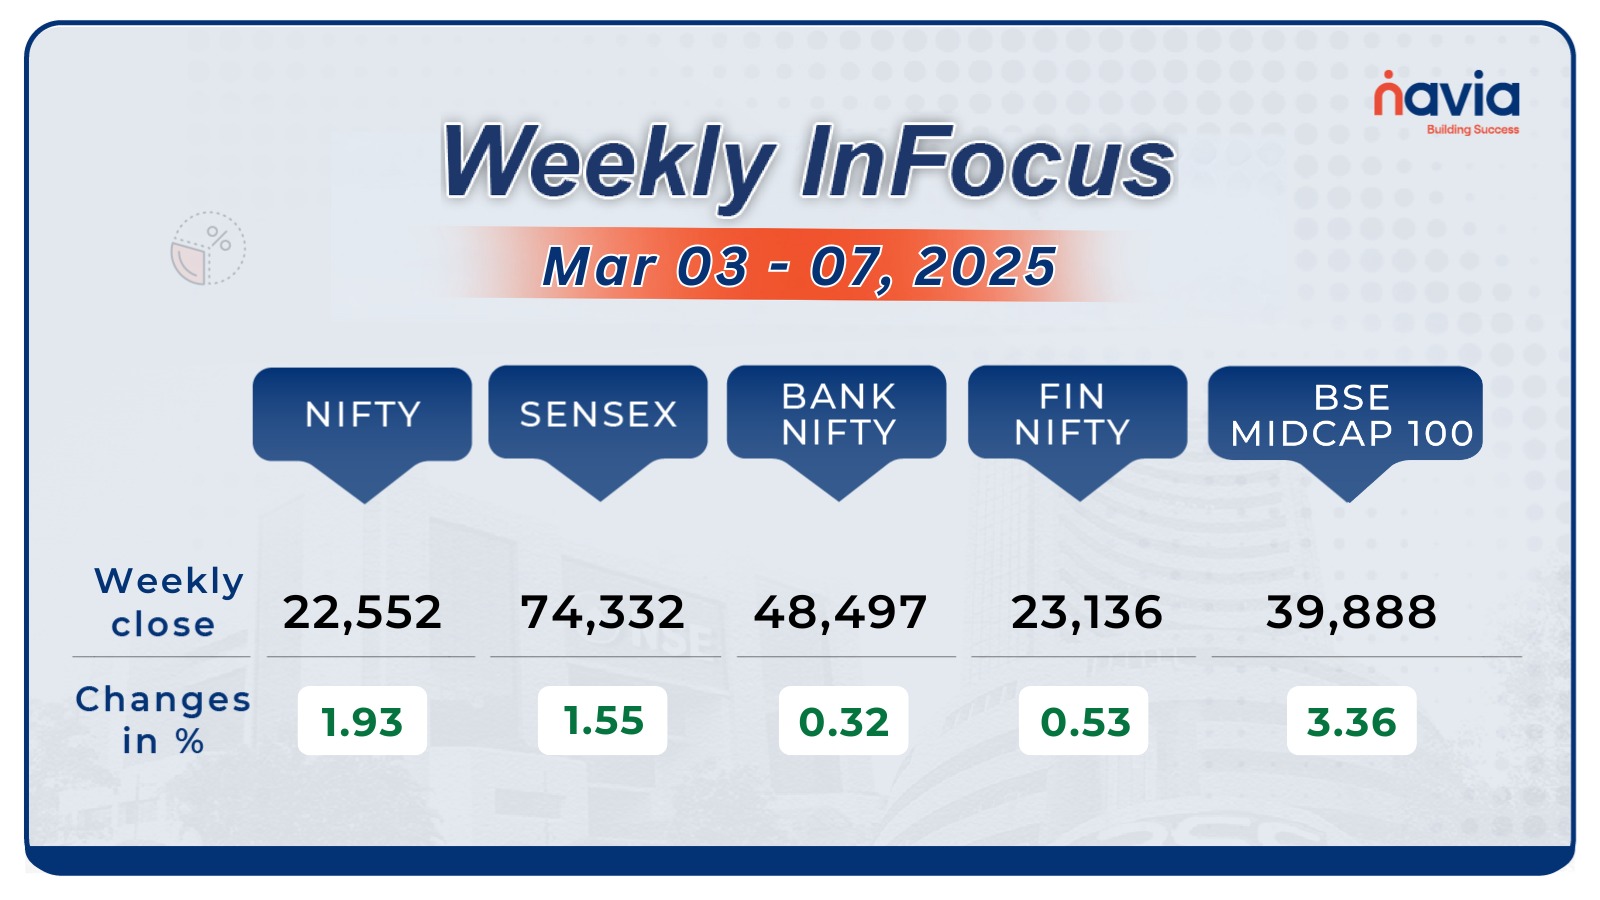
This week, the BSE Sensex index added 1134.48 points or 1.54 percent to end at 74,332.58, and Nifty50 rose 427.8 points or 1.93 percent to finish at 22,552.50.
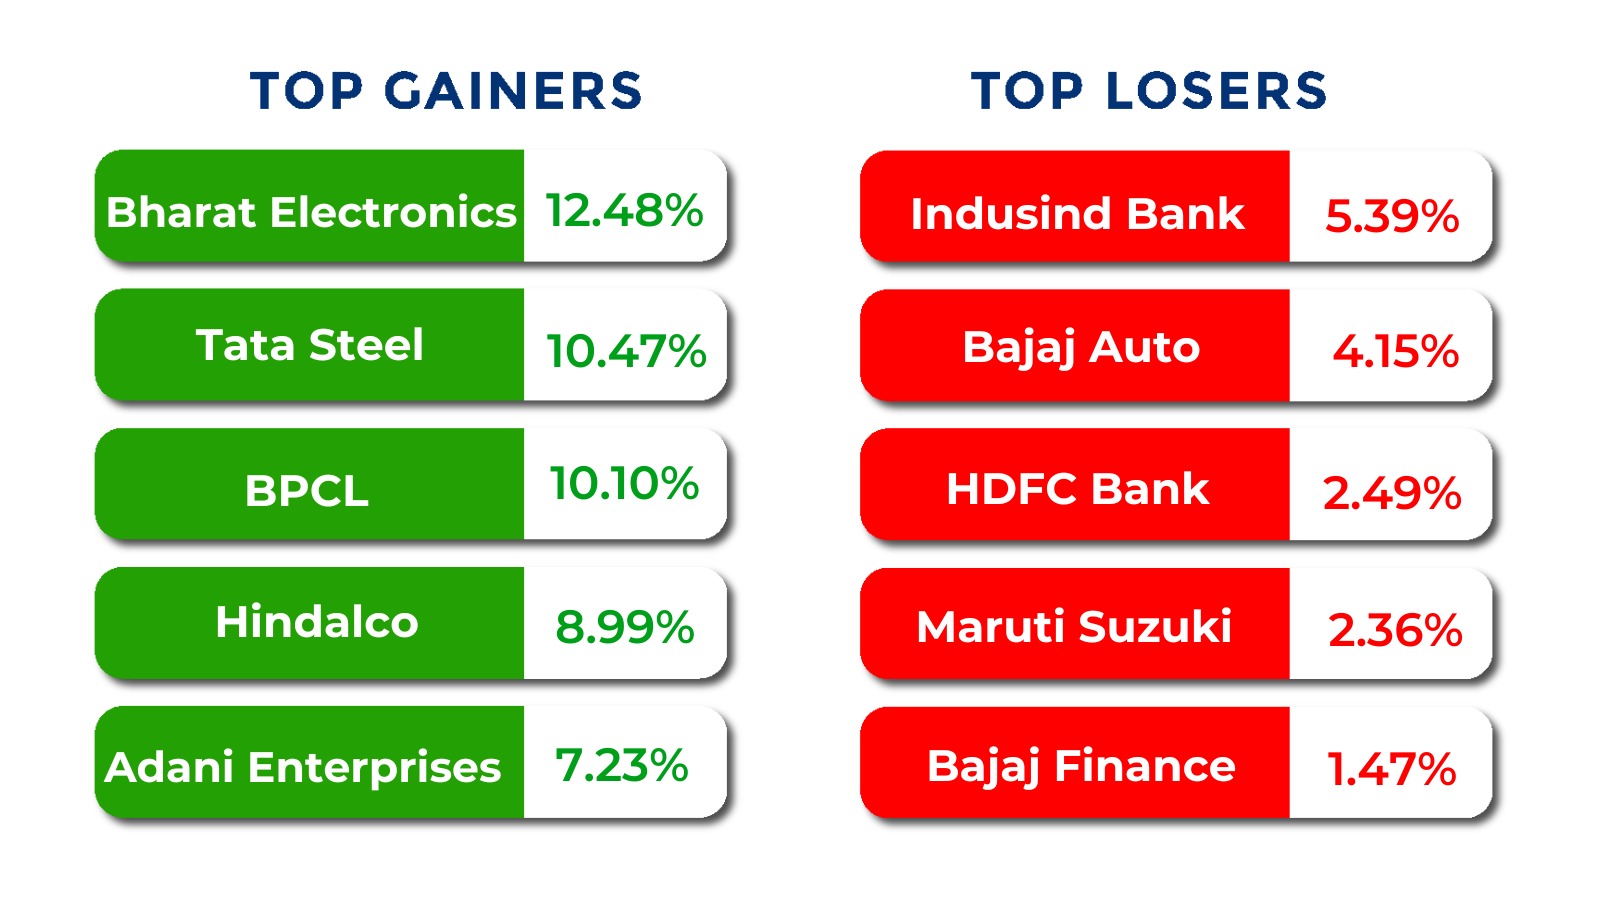
The BSE Large-cap Index rose 2.4 percent Adani Energy Solutions, Vedanta, REC, Bharat Electronics, Varun Beverages, Hindustan Aeronautics, Siemens, Tata Steel, Power Finance Corporation rose between 10-15 percent.
Interactive Zone!
Test your knowledge with our Markets Quiz! React to the options and see how your answer stacks up against others. Ready to take a guess?
Sector Spotlight

All the sectoral indices ended in the green with Nifty Metal index surged 8.3 percent, Nifty Media index added 6.8 percent, Nifty Energy index rose 5.5 percent, Nifty Oil & Gas index jumped 5 percent and Nifty PSU Bank index added 4.5 percent.
Top Gainers and Losers
Currency Chronicles
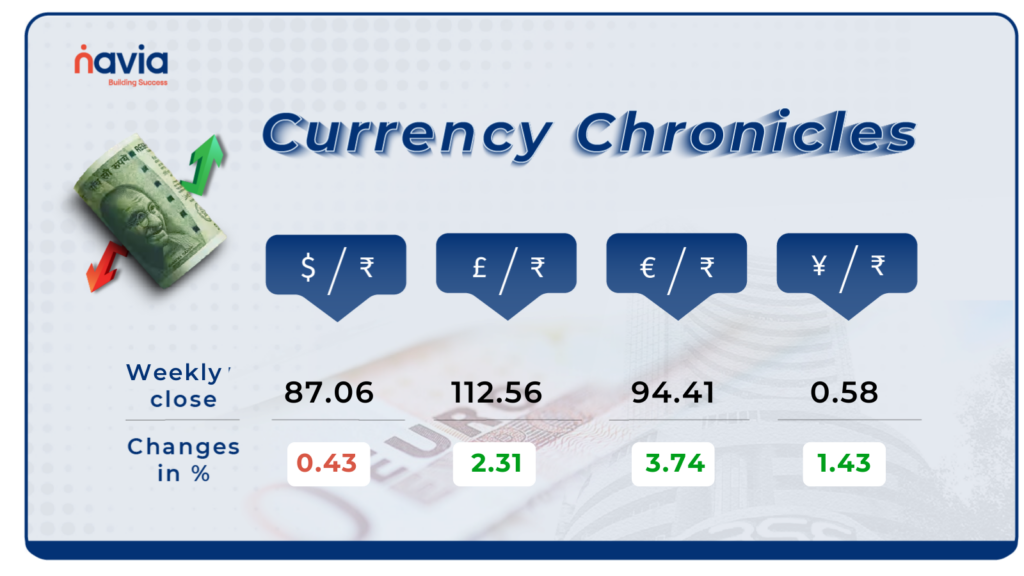
USD/INR:
The USD/INR rate closed at ₹87.06 per dollar on March 7, compared to ₹87.49 on February 28. The rate declined by 0.43% during the week, reflecting a neutral market sentiment.
EUR/INR:
The EUR/INR rate closed at ₹94.41 per euro, gaining 3.74% during the week, reflecting a bullish market sentiment.
JPY/INR:
The JPY/INR rate closed at ₹0.58 per yen, gaining 1.43% during the week, reflecting a bullish market sentiment.
Stay tuned for more currency insights next week!
Commodity Corner
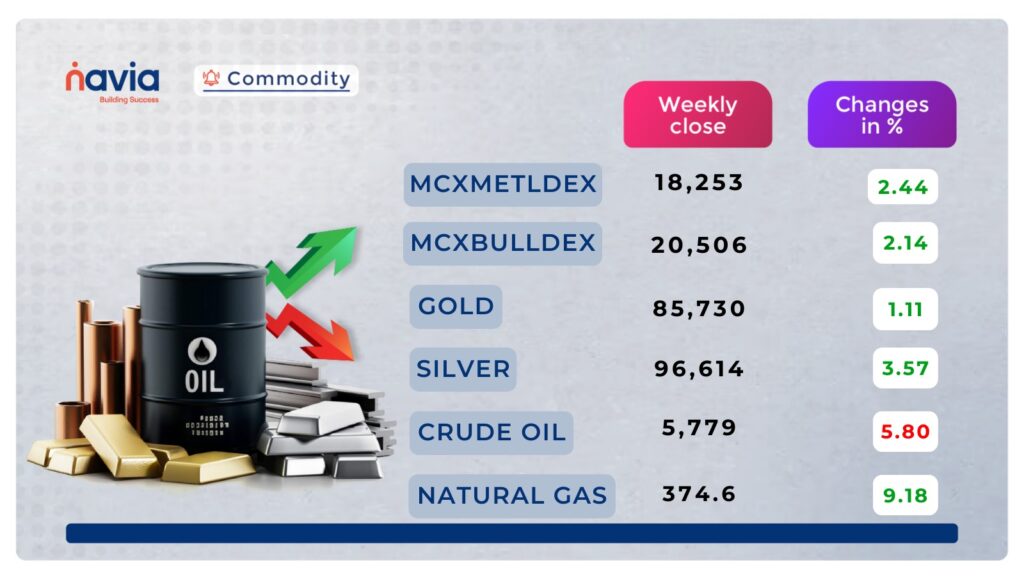
Crude oil is trading within a broken descending channel on the 1-hour chart, closing marginally positive at 5,779, up by 28 points. It recently broke below its descending channel, indicating potential weakness. Another intraday momentum move can be expected above 5,820 for an upside breakout or below 5,730 for further downside. A strong close above 6,247 could signal a breakout from the descending trend.
Recent market developments include the U.S. imposing tariffs on Canadian and Mexican crude imports, prompting Canadian producers to lower prices, which may impact U.S. refiners. Additionally, OPEC+ announced plans to increase production from April, adding to supply concerns. These factors, combined with recent price consolidations after a four-day losing streak, contribute to the volatility in crude oil prices.
Gold has been trading in a descending channel on the 15-hour chart, closing at 85,730, up by 201 points. The channel’s support zone lies in the 85,332–85,400 range, and a break below this could lead to further weakness. If gold sustains above 86,350, it may reach new highs due to bullish sentiment and technical breakouts. Intraday momentum is expected above 86,165 and below 85,570.
Natural gas has given a breakout from its descending channel on the 30-minute chart, ending the last session slightly negative at 374.6. Another intraday momentum move can be expected above 378 and below 368. An ascending channel is also visible, and in the last session, natural gas broke that channel as well.
Recent market developments include a sharp decline in Venture Global’s stock due to weaker earnings projections, raising concerns about LNG exports. In New York, discussions on lifting fracking restrictions suggest potential long-term supply changes. Meanwhile, Ireland’s finance minister signaled a shift away from broad energy subsidies amid rising electricity and gas prices, impacting European demand. These factors contribute to natural gas price movements.
Do you have a question? Ask here and we’ll publish the information in the coming weeks.
Blogs of the Week!

SME IPO Performance in India – 2024
With 247 listings and a staggering 90% win rate, the SME IPO market in India witnessed explosive growth. Some stocks soared over 400% on debut, making 2024 the year of IPOs! Which companies led the charge? Find out in this deep dive!
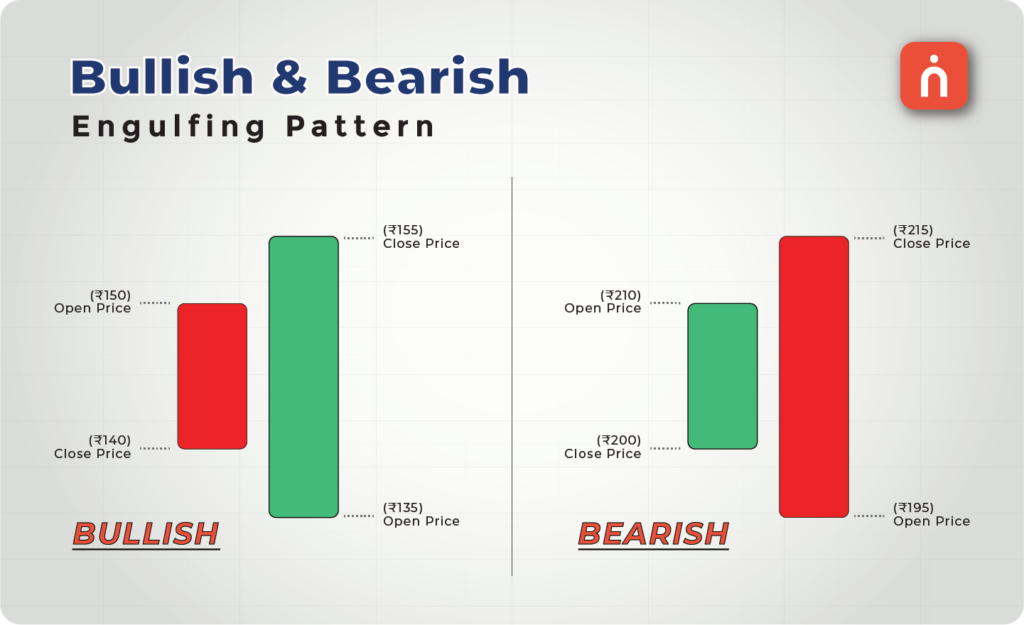
Understanding the Engulfing Pattern (Bullish and Bearish Reversal) in Technical Analysis
Can a single candlestick predict a trend reversal? The Engulfing Pattern might just be the clue traders need! Whether it’s a bullish breakout or a bearish breakdown, this pattern signals potential market shifts. Learn how to spot, interpret, and trade it effectively in this guide!
N Coins Rewards

Refer your Friends & Family and GET 500 N Coins.
Do You Find This Interesting?