Navia Weekly Roundup (Mar 09 – 13, 2026)
- Week in the Review
- Indices Analysis
- Interactive Zone!
- Sector Spotlight
- Top Gainers and Losers
- Currency Chronicles
- Commodity Corner
- Top Blogs of the Week!
- N Coins Rewards
Week in the Review
The escalating geopolitical tensions in West Asia pushed the Indian benchmark indices to their a notable weekly decline in nearly four years. Except for Tuesday’s session, the market ended lower on all other days amid negative global market sentiment, continued rupee depreciation, persistent FII selling, and rising crude oil prices.
Indices Analysis
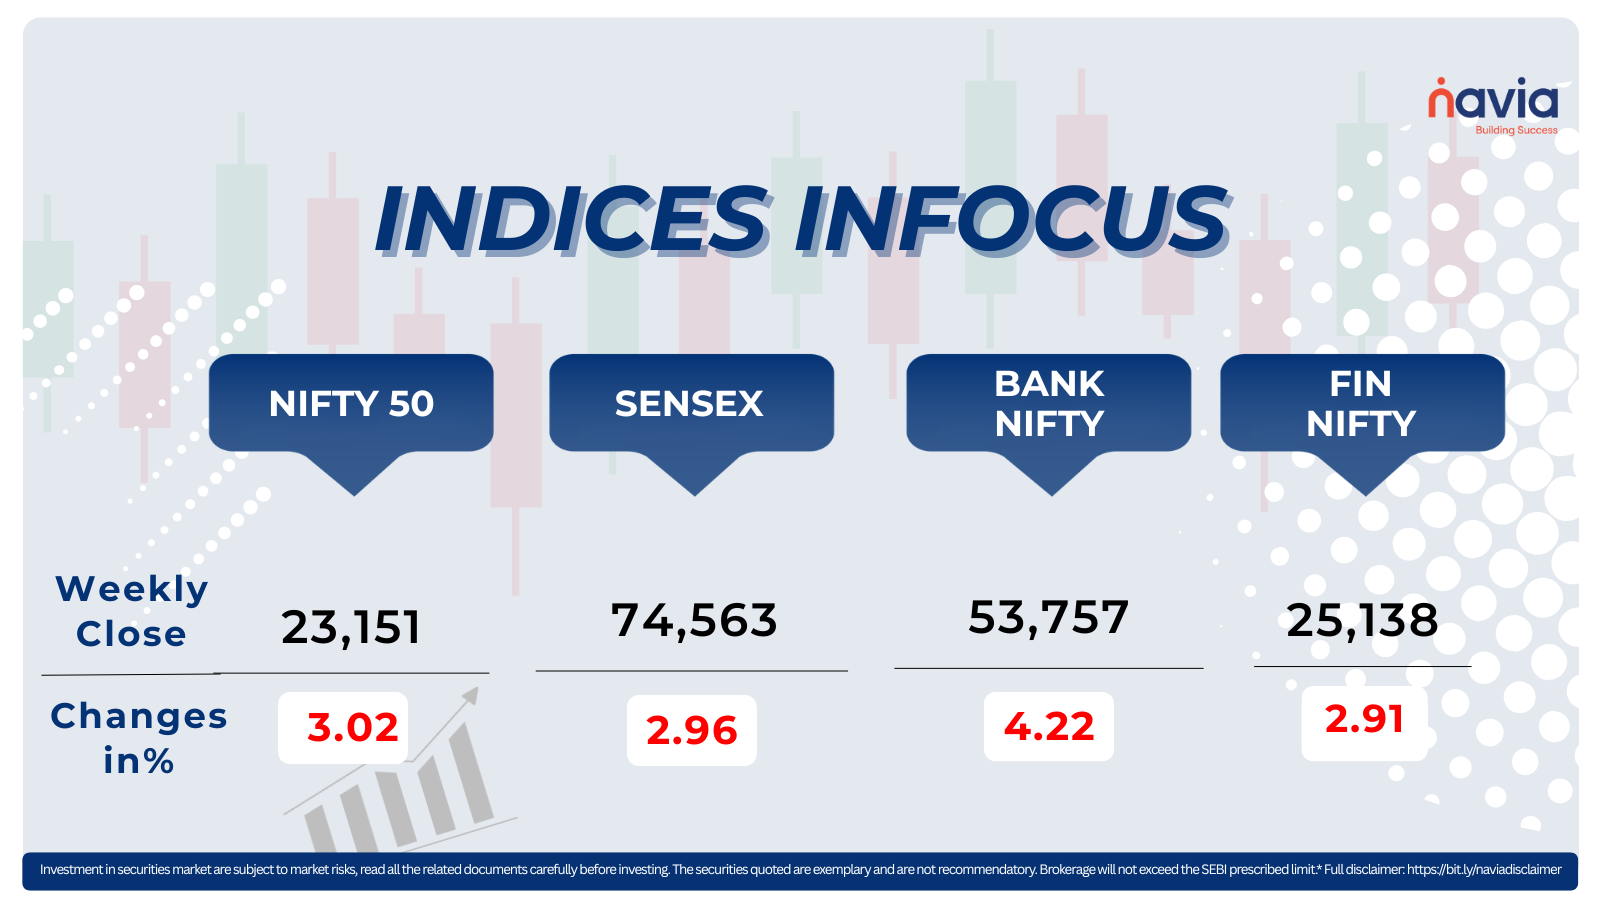
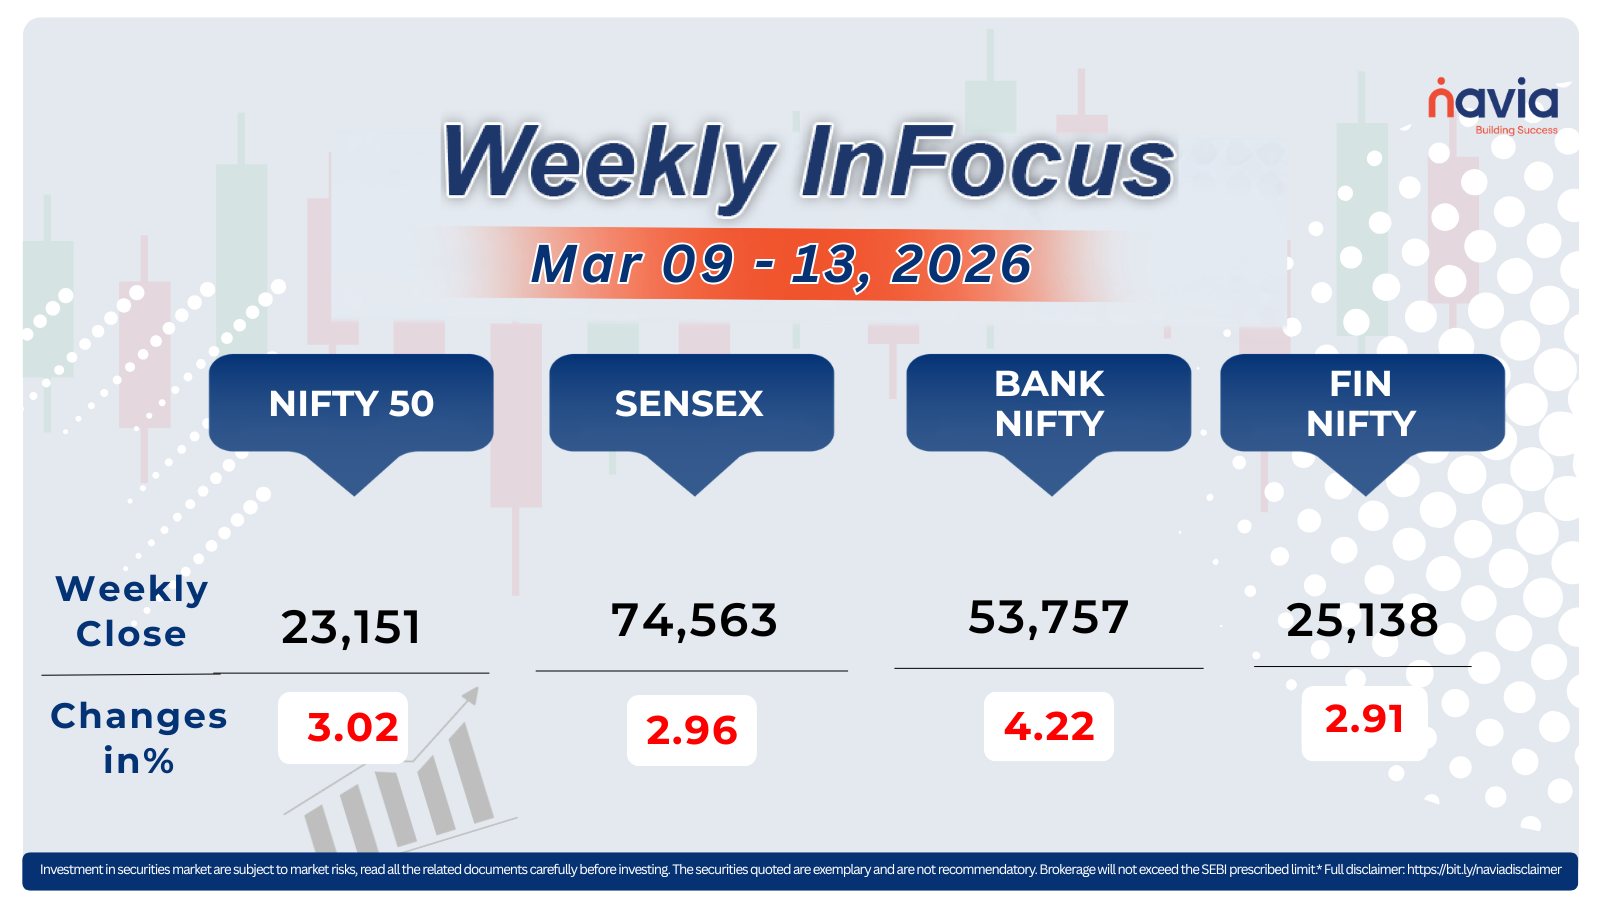
During the week, the BSE Sensex declined 2.96 percent, to close at 74,563.92, while the Nifty50 declined 3.02 percent, to end at 23,151.10.
The BSE Smallcap index shed 3.6 percent during the week, with Aqylon Nexus, Silver Touch Technologies, SEPC, InfoBeans Technologies, Amber Enterprises India, PG Electroplast, Yasho Industries, Sapphire Foods India, Capacite Infraprojects, Sunteck Realty, Rain Industries, Network People Services Technologies, Dynamatic Technologies, and Precision Wires India falling by up to 22%, while Confidence Petroleum, Chemplast Sanmar, Jindal Poly Films, Happiest Minds Technologies, Apollo Pipes, Liberty Shoes, TTK Prestige, and VTM gained between 15% and 22%.
The BSE Largecap index shed 5 percent with Polycab India, IDBI Bank, Meesho, Larsen & Toubro, TVS Motor Company, UltraTech Cement, Mahindra and Mahindra, Eicher Motors, IndusInd Bank, Maruti Suzuki India, Tata Motors Passenger Vehicles, Varun Beverages, and Tata Motors falling between 10 and 15 percent.
The BSE Midcap index declined 4.5 percent with KEI Industries, Bharat Forge, Ashok Leyland, Schaeffler India, Colgate Palmolive (India), The Ramco Cements, IDFC First Bank, Hexaware Technologies, Godrej Industries, and APL Apollo Tubes falling between 10% and 15%. However, gainers included Premier Energies, LT Technology Services, Aurobindo Pharma, Ipca Laboratories, Brainbees Solutions, Suzlon Energy, and Dixon Technologies. On the other hand, Adani Total Gas, NTPC Green Energy, Coal India, Adani Power, ABB India, and Tata Power Company advanced between 5 and 17 percent.
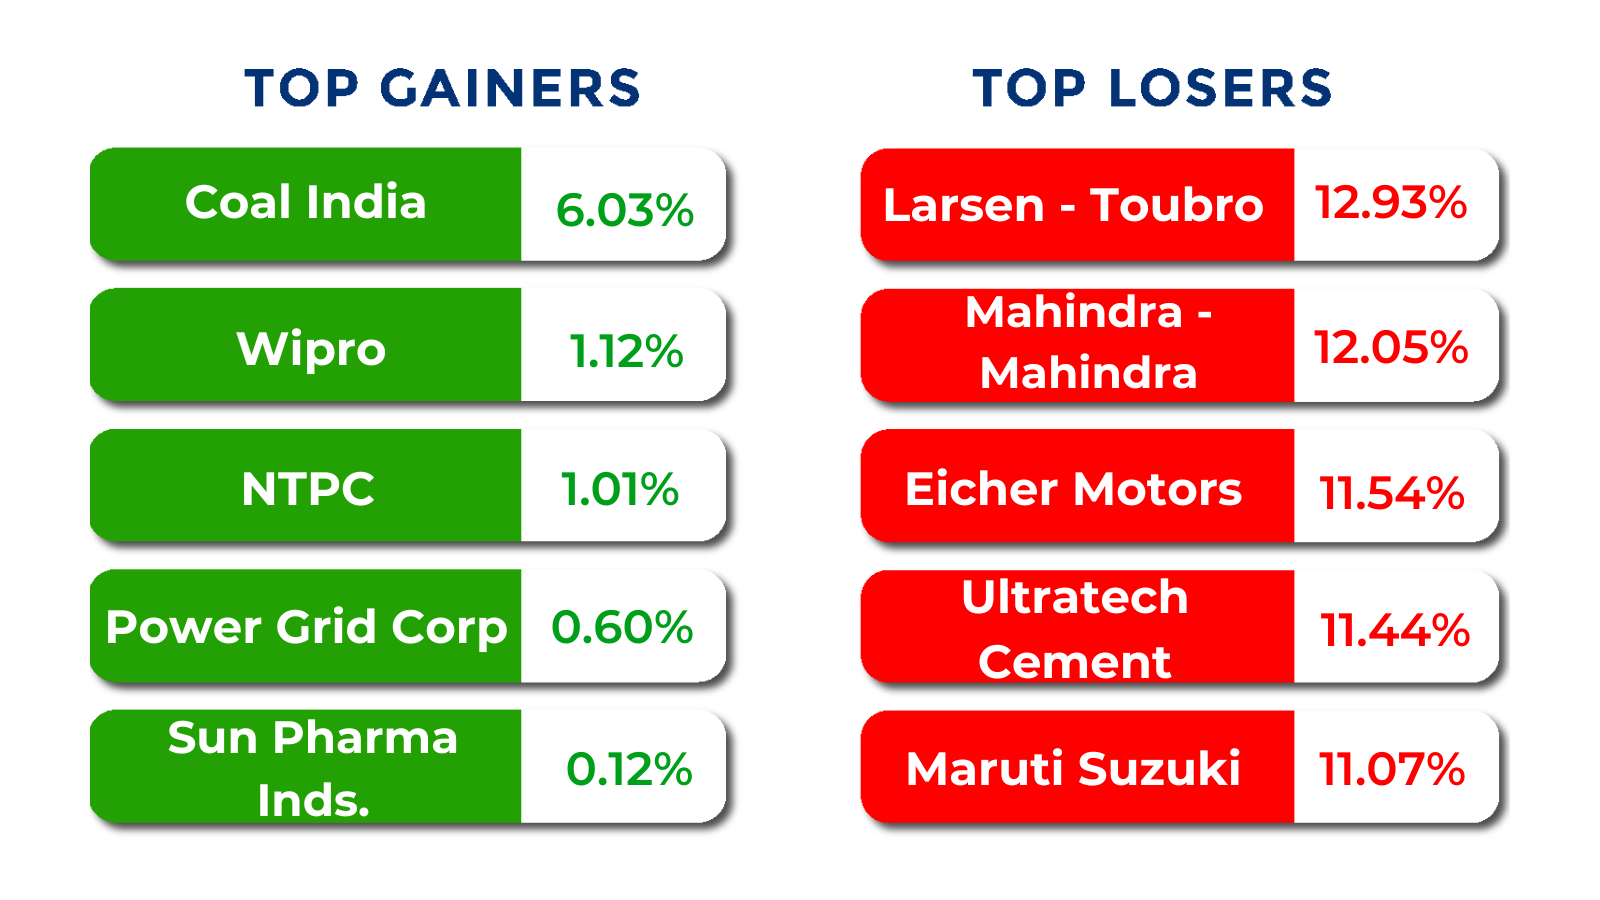
During the week, State Bank of India saw the record the largest decline in market capitalisation, followed by Larsen & Toubro, HDFC Bank, and Bajaj Finance. In contrast, NTPC, Power Grid Corporation of India, and Sun Pharmaceutical Industries recorded gains in their market capitalisation.
Foreign Institutional Investors (FIIs) extended their selling for the fourth consecutive week, offloading equities worth Rs 35,052.03 crore, while Domestic Institutional Investors (DIIs) remained net buyers with purchases worth Rs 37,739.78 crore.
Interactive Zone!
Test your knowledge with our Markets Quiz! React to the options and see how your answer stacks up against others. Ready to take a guess?
Sector Spotlight
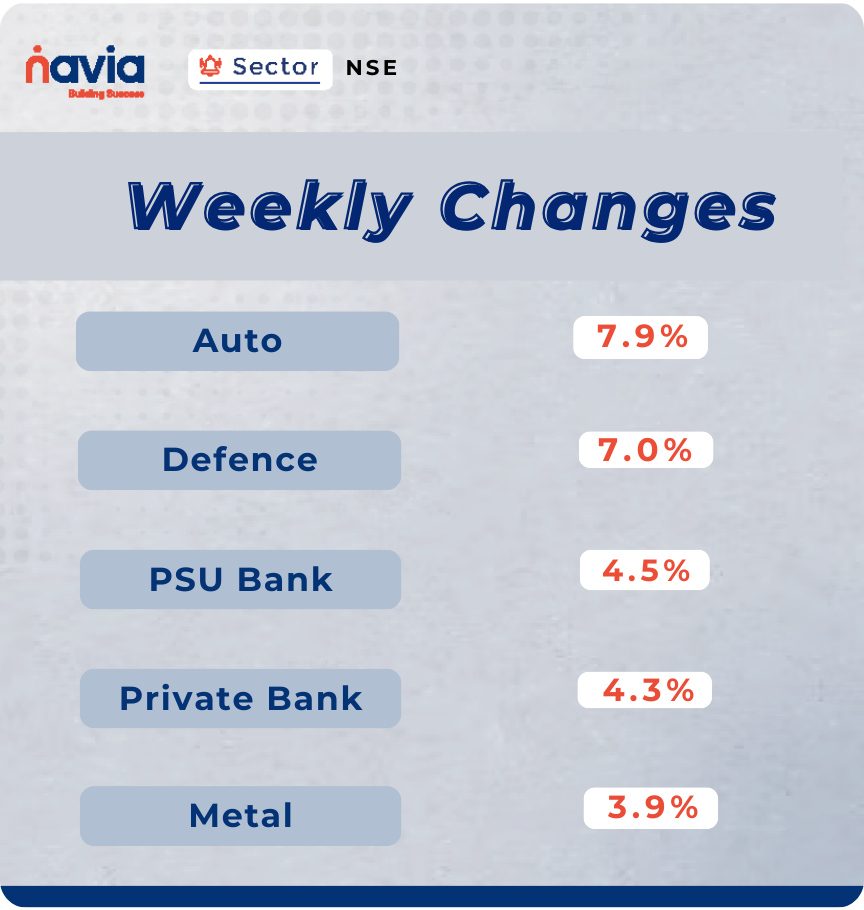
All the sectoral indices ended in the red, led by notable declines in auto and banking stocks. Nifty Auto declined 7.9%, Nifty Defence fell 7.0%, Nifty PSU Bank and Nifty Private Bank dropped above 4% each, while Nifty Metal declined 3.9%.
Top Gainers and Losers
Currency Chronicles
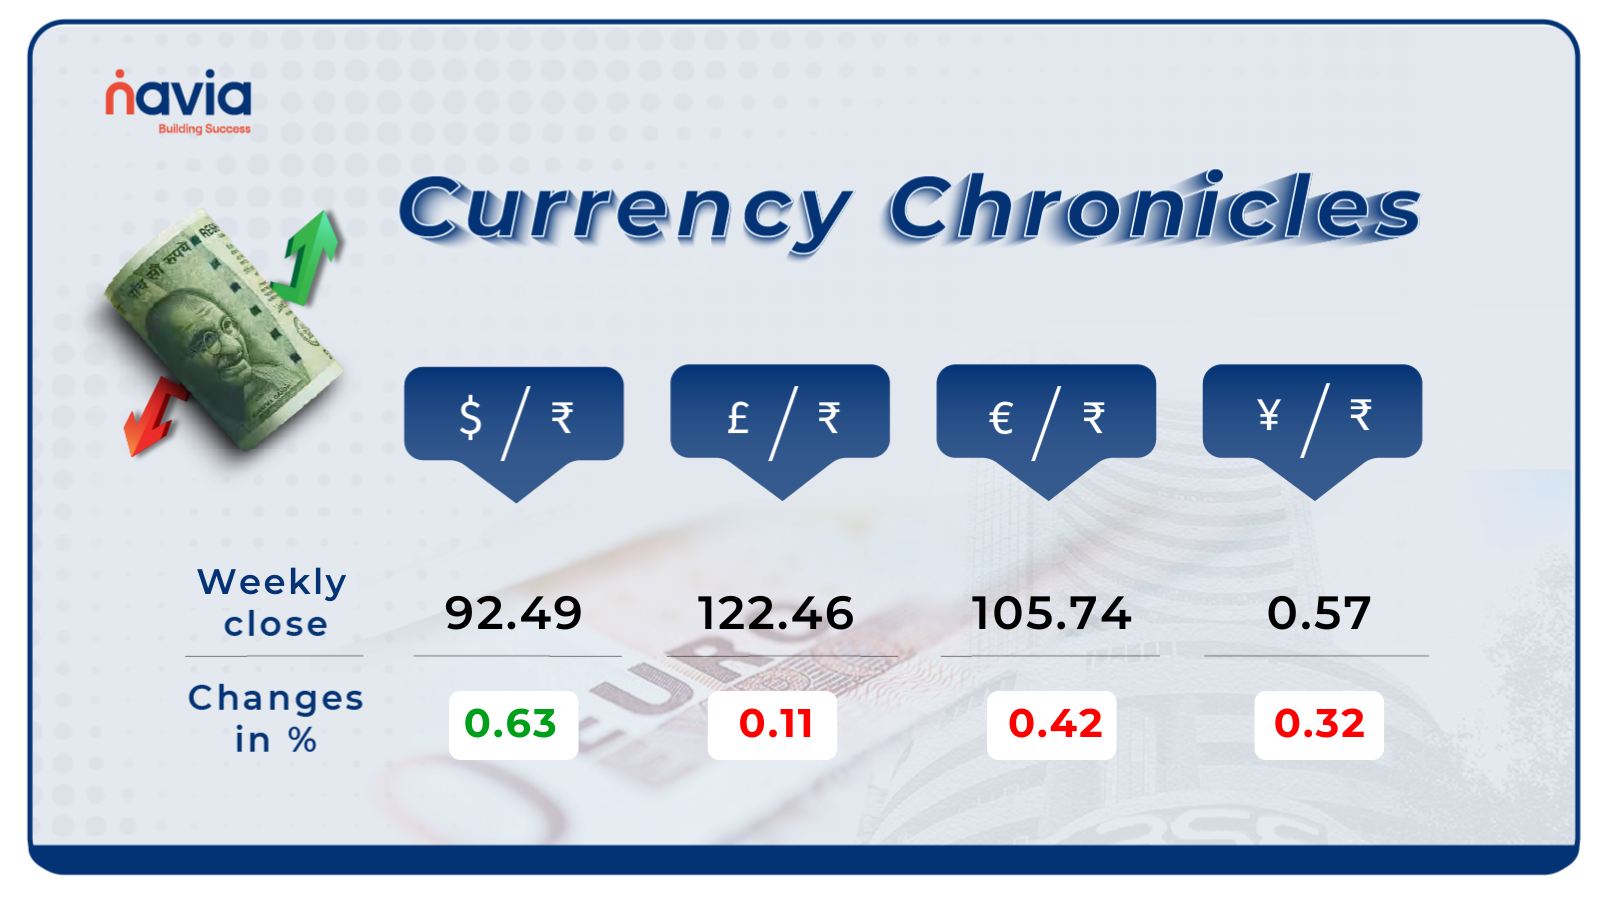
USD/INR:
The USD/INR rate closed at ₹92.49 per dollar, gaining 0.63% during the week, reflecting a bullish market sentiment.
EUR/INR:
The EUR/INR rate closed at ₹105.74 per euro, losing 0.42% during the week, reflecting a bearish market sentiment.
JPY/INR:
The JPY/INR rate closed at ₹0.57 per yen, losing 0.32% during the week, reflecting a bearish market sentiment.
Stay tuned for more currency insights next week!
Commodity Corner
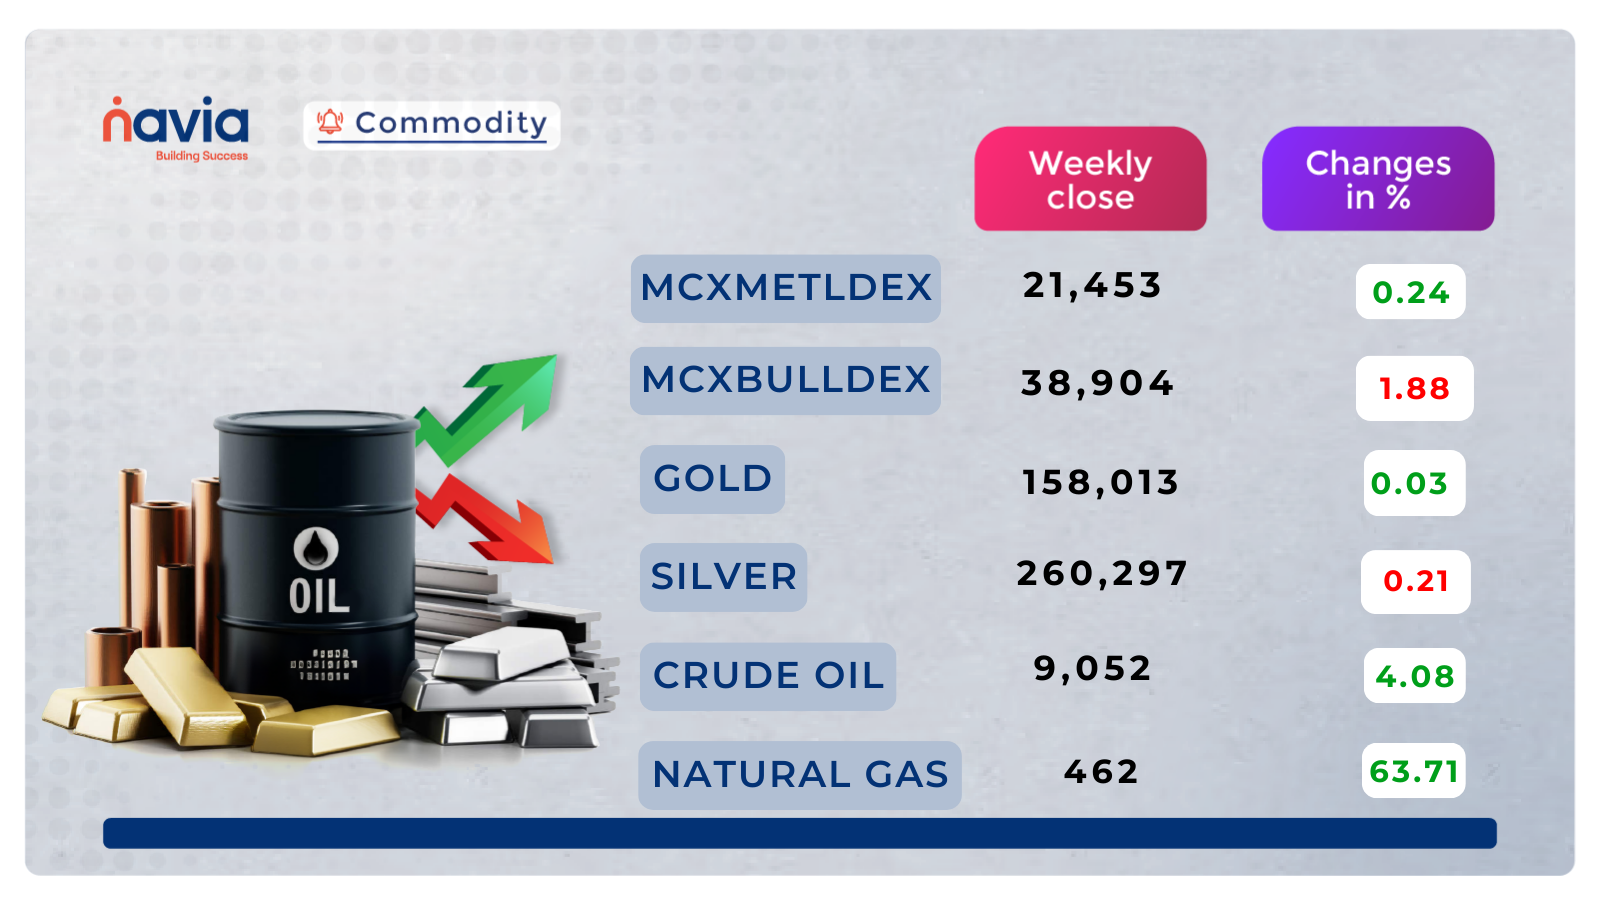
Crude Oil futures are showing a sharp corrective pullback after the strong impulsive rally toward the 9607 extension area. The price has formed a prominent red candle with increased volatility, indicating short-term profit booking or rejection near the upper levels following the breakout from the 6800–8300 zone. The overall the broader price structure reminds upward-biased on the higher timeframe, supported by the ascending trendline from the 5901–6000 base. The recent advance has been impulsive with multiple higher highs, but the latest session’s rejection suggests temporary exhaustion or consolidation after the parabolic move. A sustained close above 9000–9607 further price movement wil depend on market conditions and supply-demand factors. On the downside, immediate support lies near 8300–8500, followed by stronger levels near 7999–7402. A breakdown below 8300 may invite deeper corrective pressure toward 7999–7402, though the broader trend remians upward unless key support levels are breached unless clear rejection persists.
Gold futures are consolidating just below the immediate resistance zone around 161000–162000. Price continues to respect the ascending trendline connecting higher lows from the strong demand base near 150523–152000, maintaining a short-term bullish structure despite the mild pullback in the latest session. The current zone around 160185–161000 shows small-bodied candles and reduced volatility, indicating hesitation and balance between buyers and sellers near the upper boundary of the recent advance. The area near 161967–162000 remains a persistent supply barrier with multiple tests showing rejection. A decisive breakout and sustained close above 162000 may indicate continued price movement and could move toward higher price levels. On the downside, immediate support lies near 158902–158000, followed by stronger structural support at 150523–152000. A breakdown below 158902 may invite short-term corrective pressure toward 156000–150523 levels.
Natural Gas futures are showing strong bullish momentum after breaking and sustaining above the key resistance zone around 290–307.9. The price has formed a clear higher high and higher low structure, with the latest green candle closing near highs and confirming follow-through buying following the reversal from the 257.9–260 demand base. The descending trendline from February highs has been decisively broken, shifting the short-term bias firmly bullish and validating the breakout from the multi-week downtrend channel. The advance above 290–307.9 has been supported by increased volatility and buyer aggression, though the current level near 297 is seeing some consolidation after the sharp move. A sustained close above 307.9–310 future price movements will depend on market conditions. On the downside, immediate support now lies near 290–295, followed by stronger demand at 270–274 and deeper levels near 257.9–260. A breakdown below 290 would be required to challenge the current bullish shift and invite corrective pullback toward 270–260, though price movement currently reflects upward momentum.
Silver futures are consolidating in the upper portion of the recovery range after a modest pullback from the 270000 area. Price continues to hold firmly above the ascending trendline connecting higher lows from the major demand base near 231368–257971, preserving the short-term bullish structure with consistent buyer support on dips. The broader structure remains range-bound between the strong demand zone at 231000–240000 and the persistent supply/resistance area around 270000–291941. The current consolidation near 267000–269000 acts as short-term support, with the latest small red candle showing controlled profit booking and hesitation near the upper channel boundary. A decisive breakout and sustained close above 270000 may indicate continued upward price movement and potentially could lead to movement toward higher resistance levels . On the downside, immediate support lies at 266000–267000, followed by stronger demand near 260000 and the major zone at 257971–231368. A breakdown below 266000 may invite short-term corrective pressure toward 260000–231000.
Do you have a question? Ask here and we’ll publish the information in the coming weeks.
Top Blogs of the Week!

Understanding Recent Developments in India’s IPO Market in 2026
As we move through March 2026, the Indian IPO market is undergoing a significant “reality check.” While the quantity of companies going public remains high, the era of automatic listic gains has evolved into a period of extreme selectivity.

Market Volatility: Understanding Market Movements During Periods of Uncertainty
The Indian markets are navigating a period of heightened volatility. Following the recent geopolitical escalations in the Middle East; specifically the strikes involving the U.S., Israel, and Iran; the NIFTY 50 has witnessed a sharp 1,000-point decline.
N Coins Rewards

Refer your Friends & Family and GET 500 N Coins.
Do You Find This Interesting?

DISCLAIMER: Investment in securities market are subject to market risks, read all the related documents carefully before investing. The securities quoted are exemplary and are not recommendatory. Full disclaimer: https://bit.ly/naviadisclaimer.