Navia Weekly Roundup (June 22 – 25, 2026)
- Week in the Review
- Indices Analysis
- Interactive Zone!
- Sector Spotlight
- Top Gainers and Losers
- Currency Chronicles
- Commodity Corner
- Top Blogs of the Week!
- N Coins Rewards
Week in the Review
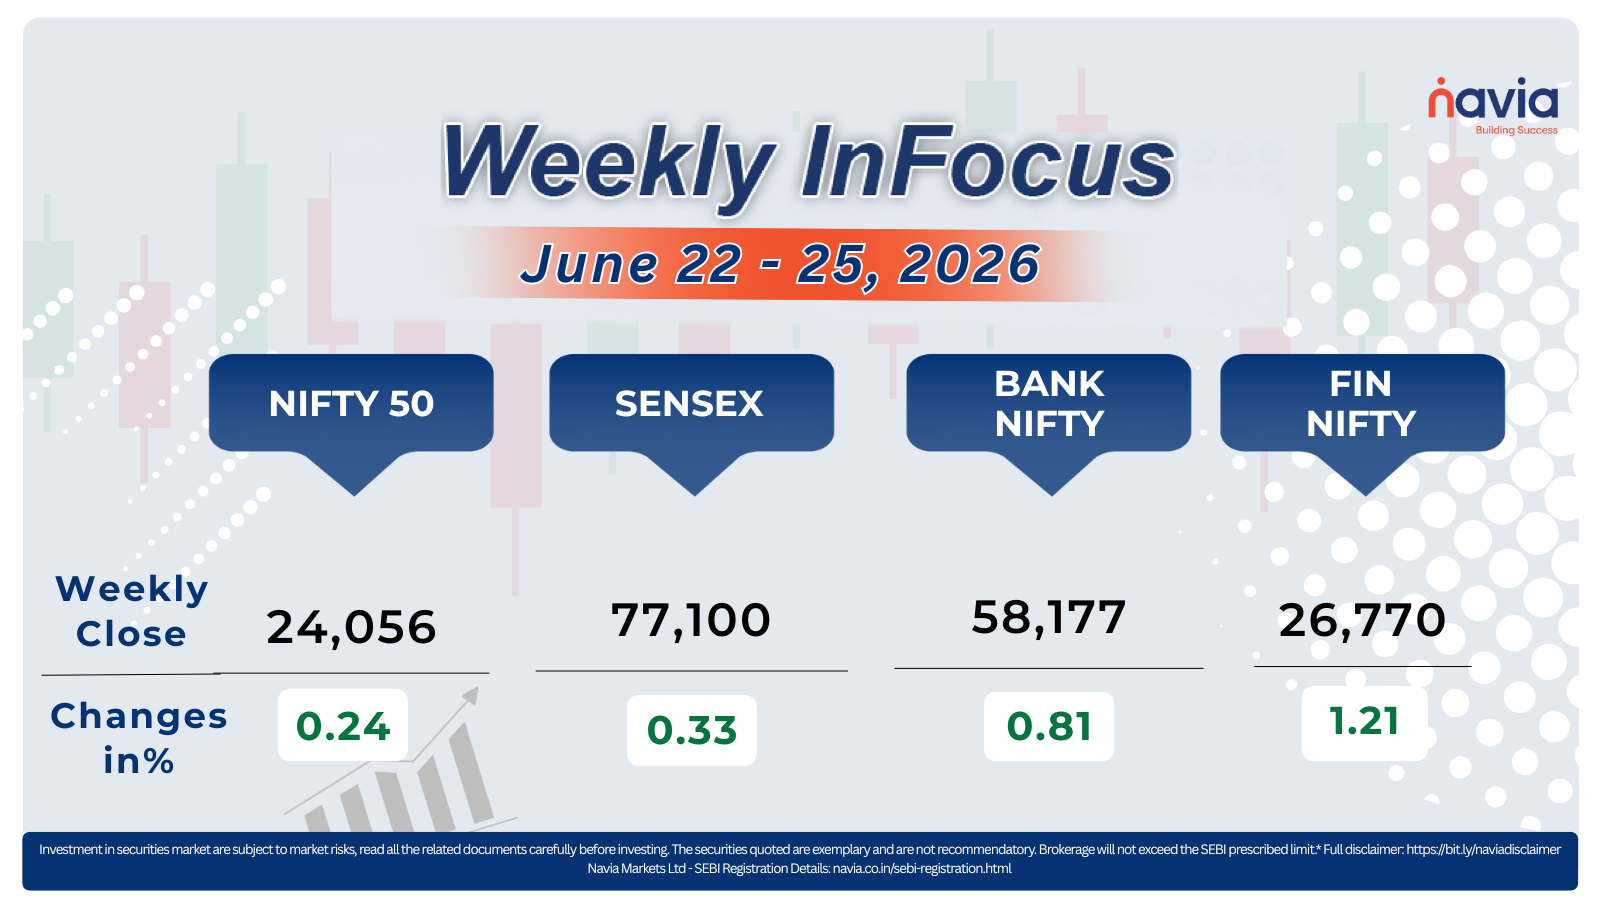
Indian benchmark indices ended the holiday-shortened week higher, with the Nifty 50 hitting a more than one-month high above 24,250, aided by easing geopolitical tensions, a sharp correction in crude oil prices to pre-Iran conflict levels, sustained domestic institutional buying, improving foreign inflows, and positive global risk sentiment.
Indices Analysis
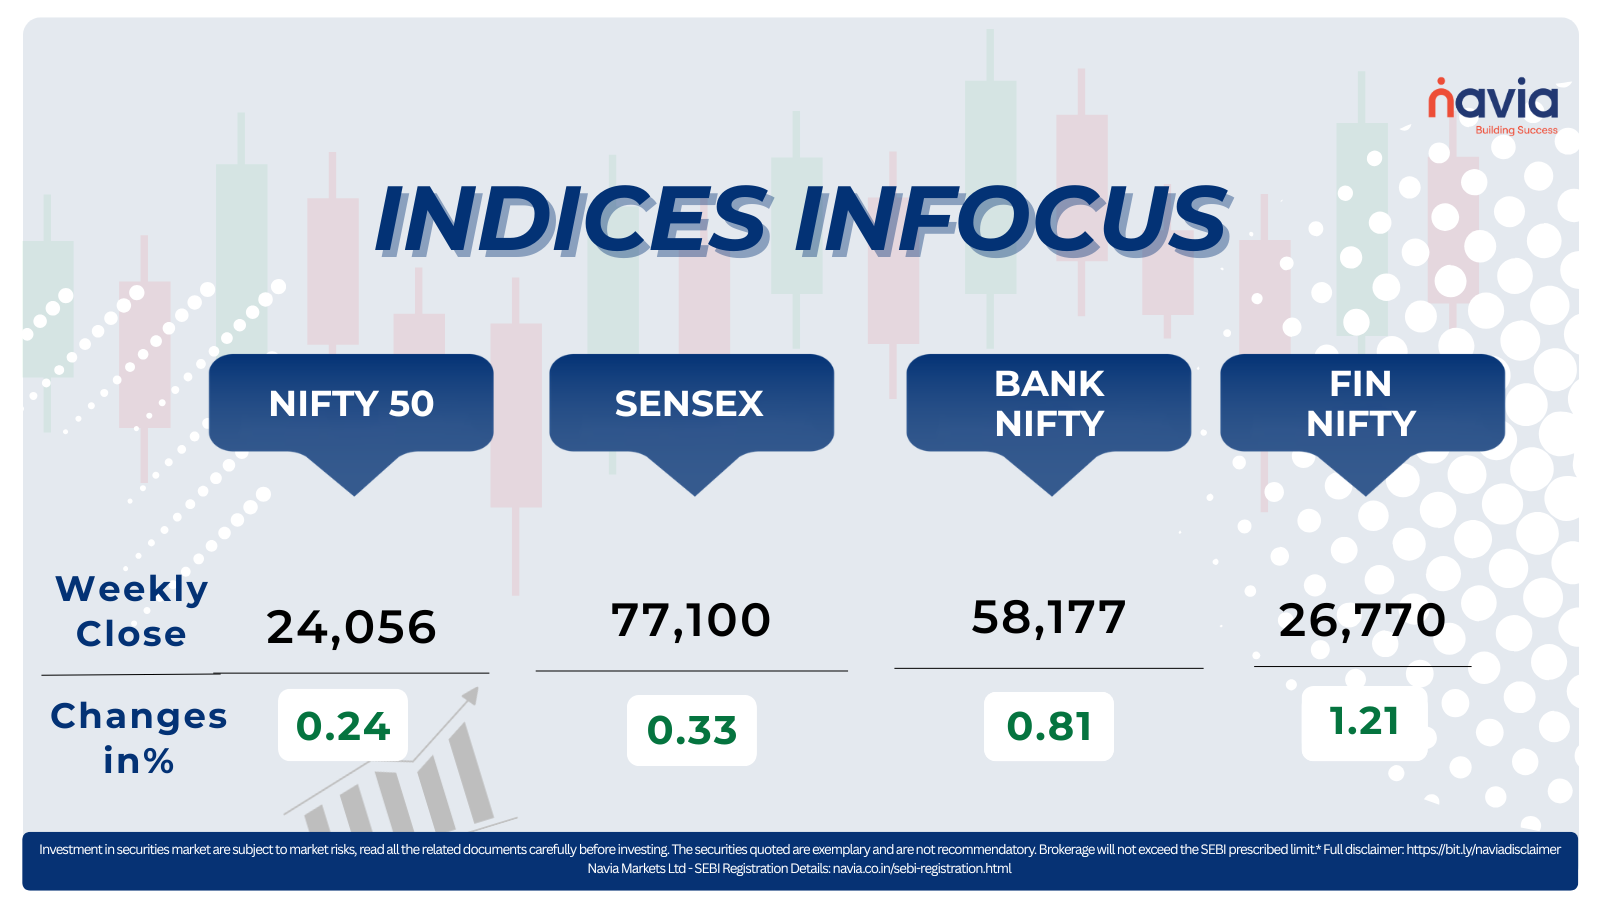
For the week, the BSE Sensex added 0.33%, to close at 77,100.47, while the Nifty 50 gained 0.24%, to end at 24,056.
The Nifty Smallcap 100 ended flat. Among the major losers were IFCI, Data Patterns (India), SignatureGlobal India, Angel One, Aster DM Healthcare, JBM Auto, Reliance Power, KFin Technologies, Gujarat Mineral Development Corporation, Five-Star Business Finance and IIFL Finance. On the gaining side, Aegis Logistics, Cohance Lifesciences, Meesho, Piramal Pharma, Gland Pharma, Aditya Birla Real Estate and Pine Labs outperformed.
The Nifty Midcap 100 index shed 1 percent. National Aluminium Company, GE Vernova T&D India, Hitachi Energy India, Tube Investments of India, KEI Industries, Vodafone Idea, Polycab India, Swiggy, 360 ONE WAM and Steel Authority of India were among the top losers, falling between 5 percent and 11 percent. On the other hand, Oracle Financial Services Software, Mahindra & Mahindra Financial Services, Bharat Forge, NHPC, Hindustan Petroleum Corporation and L&T Finance bucked the broader trend, emerging as the top gainers.
Foreign Institutional Investors (FIIs) remained net sellers during the week, offloading equities worth more than ₹2,000 crore. However, the selling was comfortably absorbed by Domestic Institutional Investors (DIIs), who extended their buying streak by purchasing equities worth over ₹11,000 crore, providing a strong cushion to the market.
The total market capitalisation of BSE-listed companies declined by more than ₹2 lakh crore during the holiday-shortened week, reflecting profit booking in select heavyweight stocks despite the benchmarks ending higher. Among the biggest gainers in terms of market value were ICICI Bank, HDFC Bank, InterGlobe Aviation and Mahindra & Mahindra, driven by strong buying interest. On the other hand, Bharti Airtel, Bharat Electronics and NTPC were among the top laggards, witnessing the sharpest erosion in market capitalisation during the week.
Interactive Zone!
Test your knowledge with our Markets Quiz! React to the options and see how your answer stacks up against others. Ready to take a guess?
Sector Spotlight
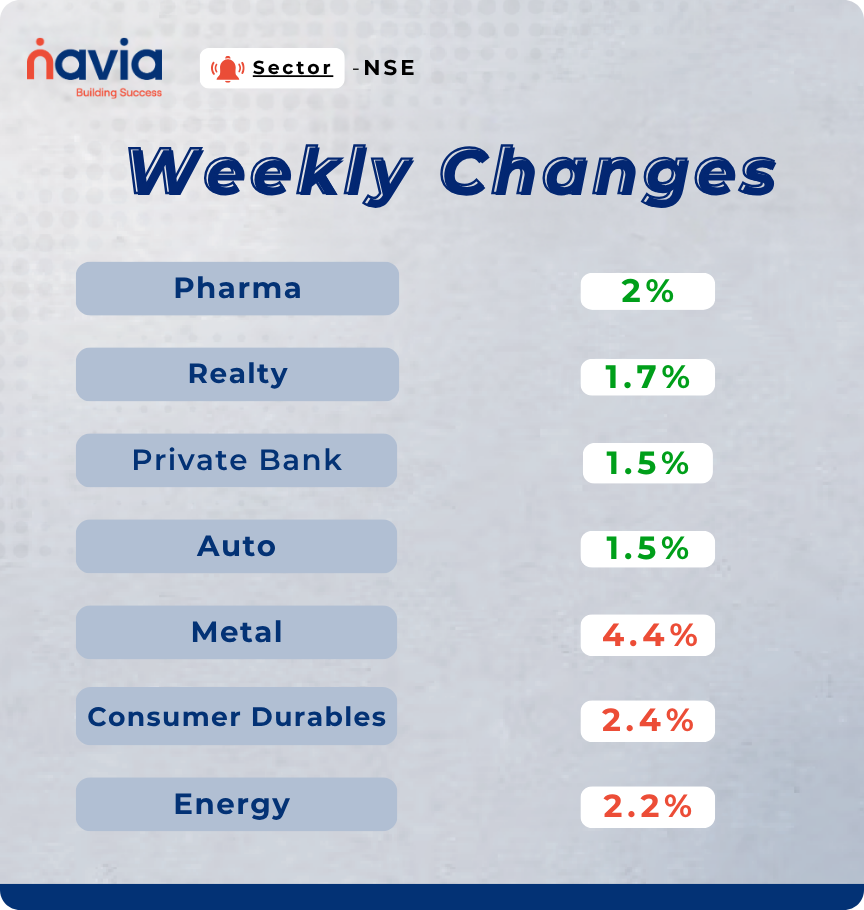
Sectorally, Nifty Pharma index added 2 percent, Nifty Realty index rose 1.7 percent, Nifty Private Bank and Nifty Auto indices added 1.5 percent each. On the other hand, Nifty Metal index was the worst hit, down 4.4 percent, Nifty Consumer Durables down 2.4 percent, and Nifty Energy indices shed 2.2 percent.
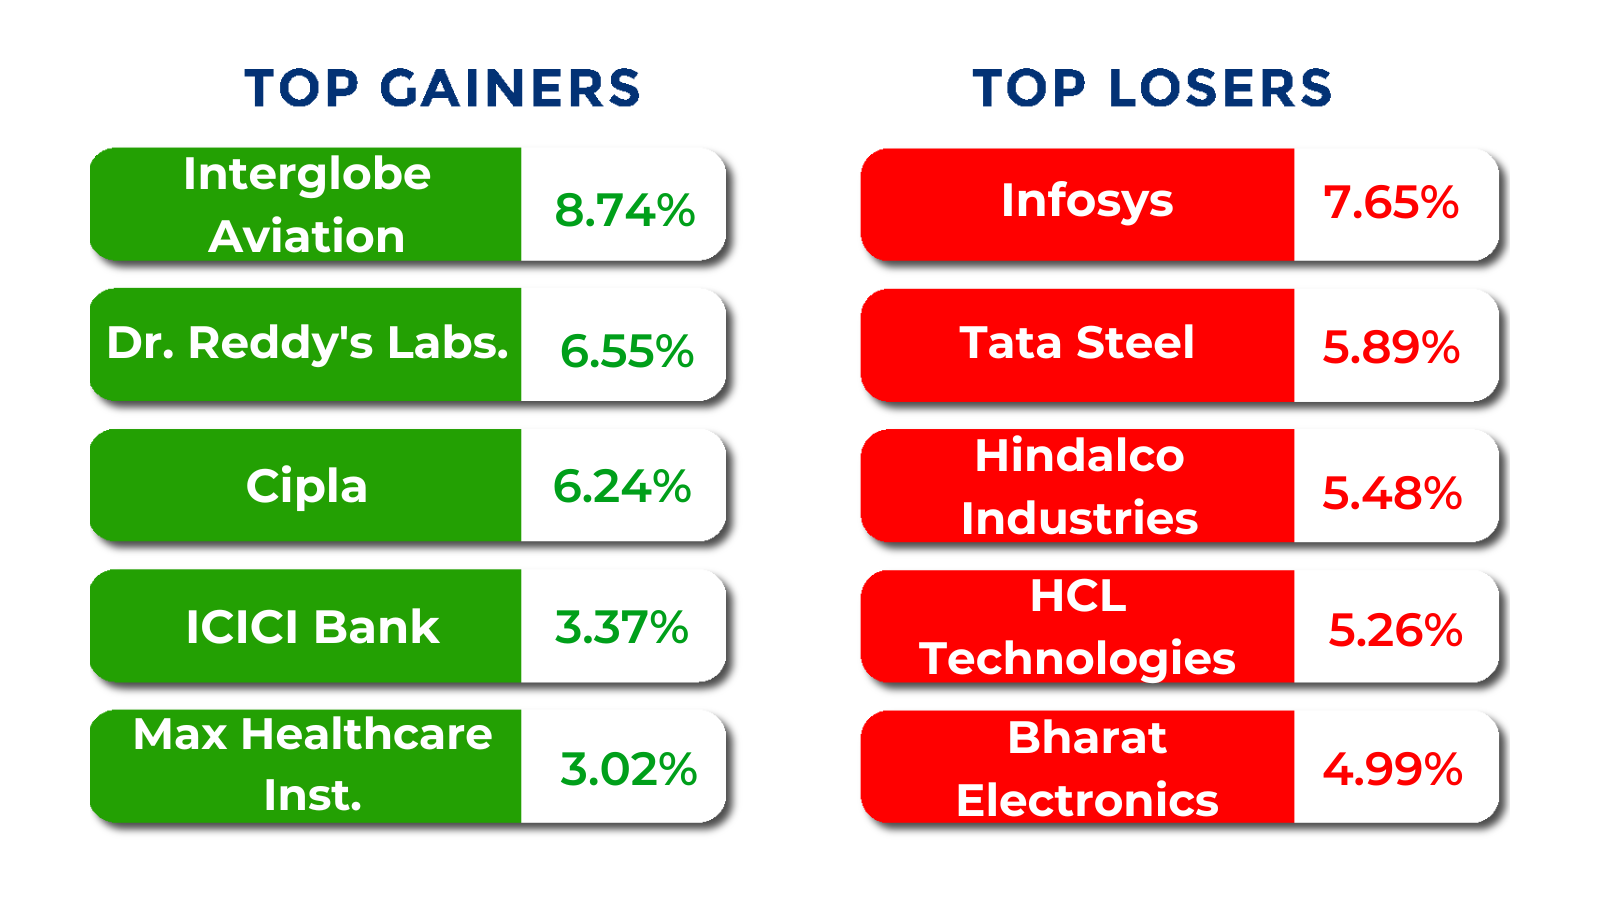
Top Gainers and Losers
Currency Chronicles
USD/INR:
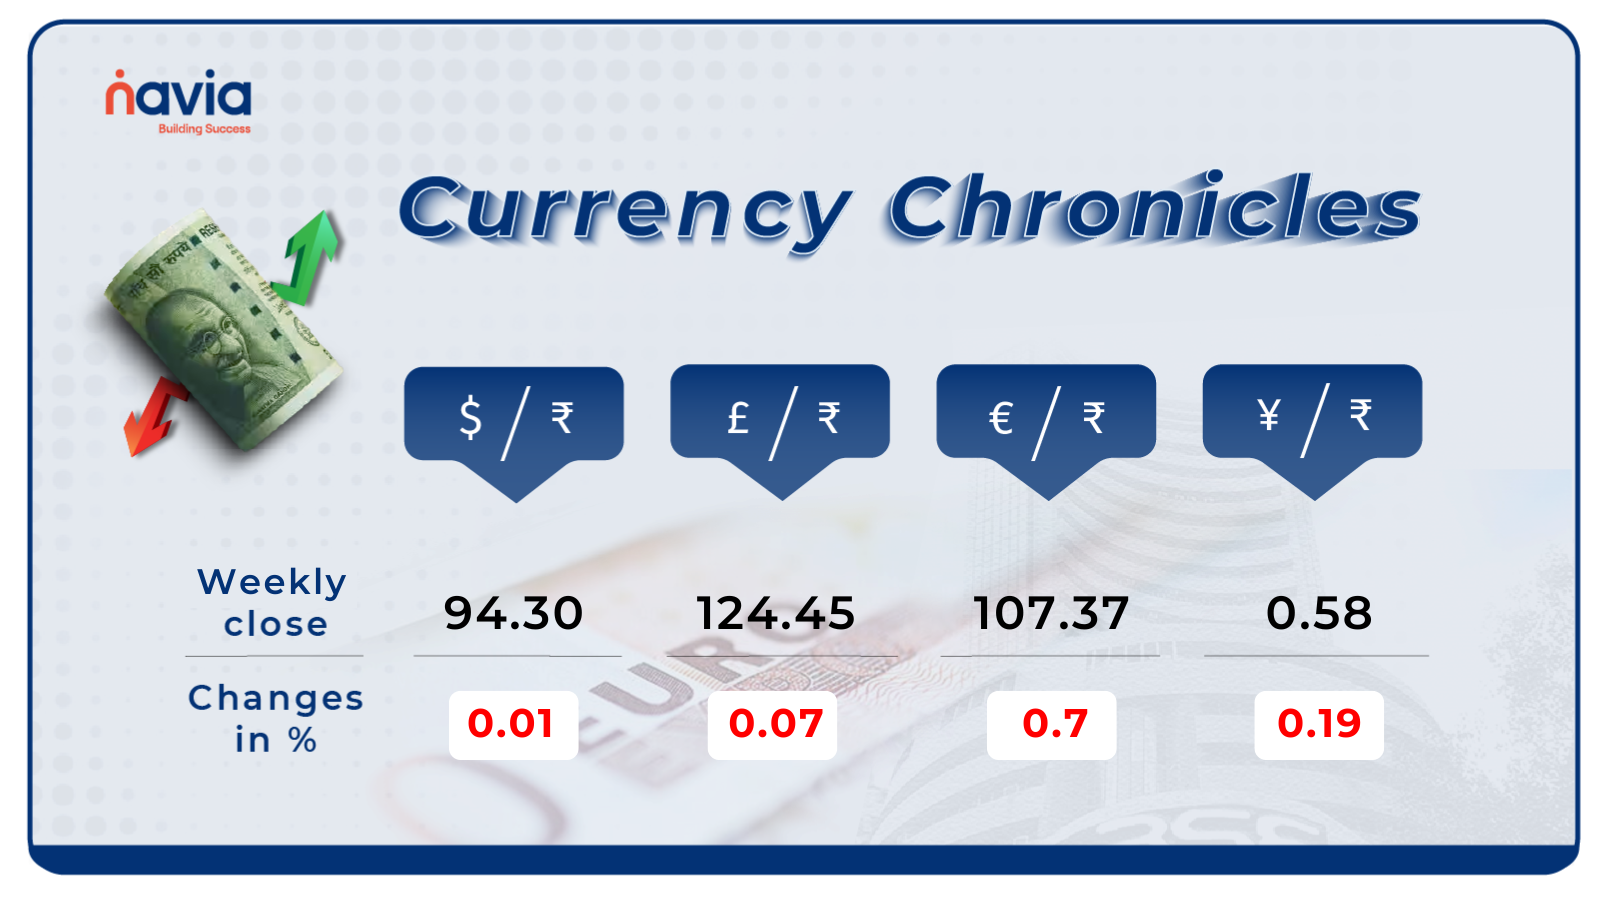
The USD/INR rate closed at ₹94.30 per dollar, down 0.01% for the week, reflecting bearish market sentiment.
EUR/INR:
The EUR/INR rate closed at ₹107.37 per euro, down 0.7% for the week, reflecting bearish market sentiment.
JPY/INR:
The JPY/INR rate closed at ₹0.58 per yen, down 0.19% for the week, reflecting bearish market sentiment.
Stay tuned for more currency insights next week!
Commodity Corner
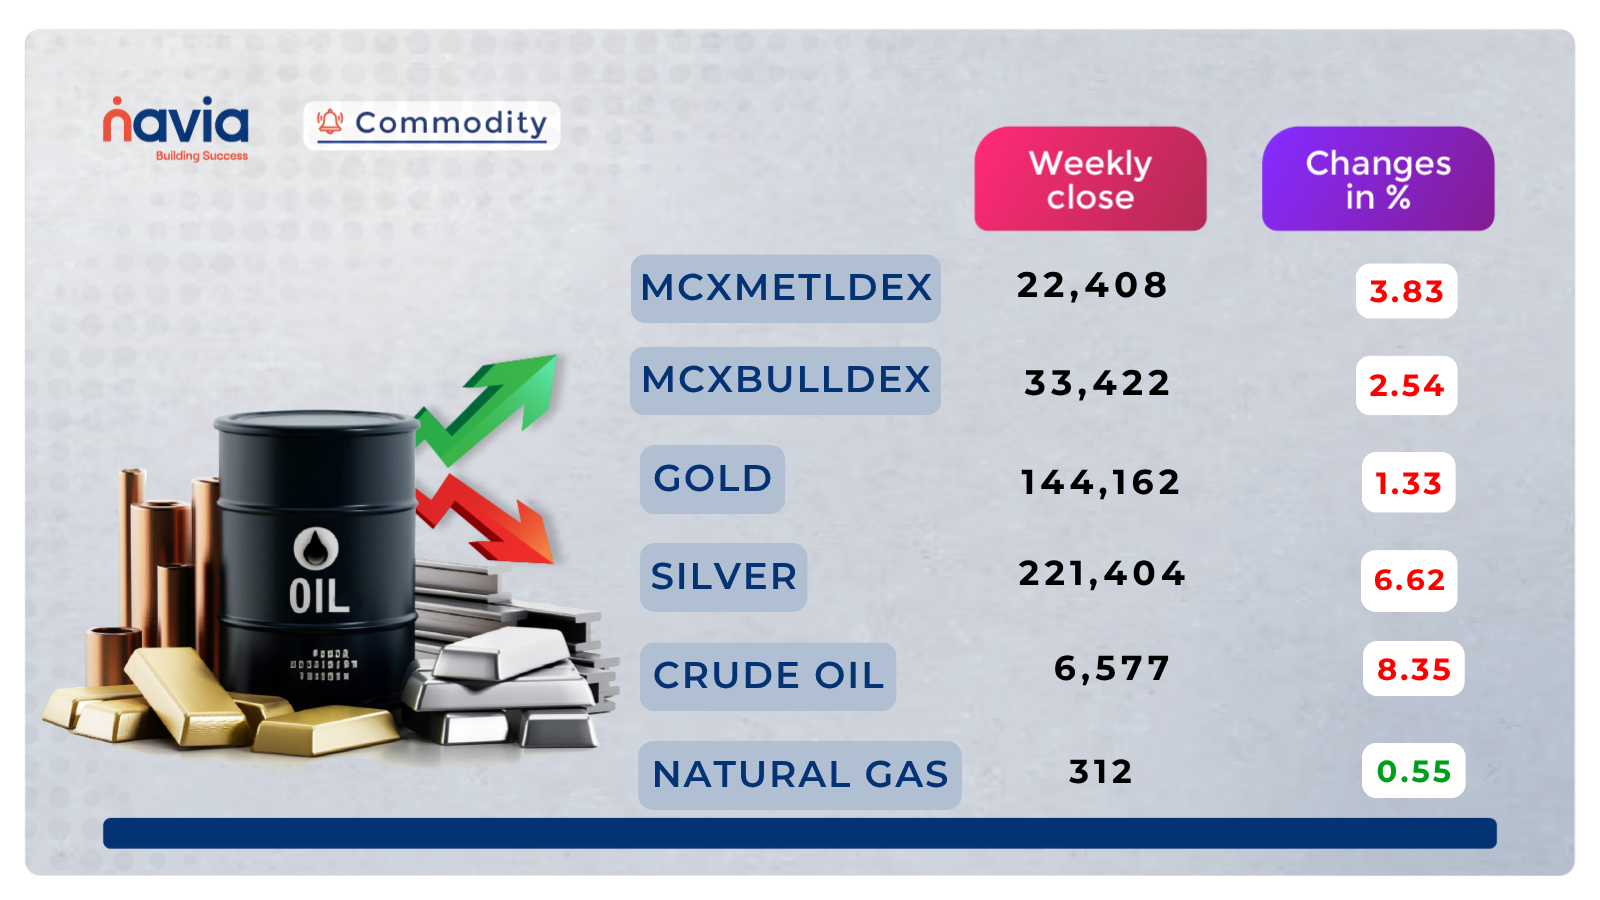
Crude Oil futures continuing the sustained and aggressive corrective decline that has taken price from the 8,400–8,800 zone all the way to current multi-month lows. The prior session’s red candle extends an unrelenting sequence of lower highs and lower lows, with the market showing no meaningful base formation and buyers consistently failing to mount any sustained defence at prior support levels across the entire corrective phase.
The short-term bias is firmly bearish, with price trading below the 6,600 resistance band and the descending structure from the June highs showing no signs of abating. A decisive close above 6,600 would be the minimum requirement to signal any meaningful stabilisation and invite buying toward 6,645 and 6,690, though the weight of the prior decline and the absence of any bullish candle conviction continue to cast doubt on the durability of any recovery attempt. Until 6,600 is reclaimed convincingly on a closing basis, sellers remain firmly in control.
On the downside, immediate support is seen near 6,485. A sustained close below 6,485 would confirm the continuation of the bearish phase and expose 6,440 and 6,395, extending the multi-week decline further into fresh multi-month lows. Sellers retain the decisive near-term advantage, and any bounce toward resistance should be treated with caution given the strength of the prevailing downtrend.
Gold futures extending the sharp and sustained corrective decline from the mid-May highs near 162,000 to fresh multi-month lows near the 140,331–141,435 demand zone. The descending trendline connecting lower highs from the May peak continues to press price relentlessly lower, and the recent sessions have seen multiple new lows established without any meaningful buyer intervention, reflecting broad-based seller dominance across the entire corrective phase.
The short-term bias is firmly bearish, with price trading below the 142,000 resistance band and the descending trendline maintaining decisive overhead pressure. A close above 142,000 would be the minimum requirement to begin signalling any near-term stabilisation and invite a recovery toward 143,500 and 145,000. Until that level is reclaimed convincingly, the structure continues to favour sellers on every intraday bounce, with the prior support levels having all transitioned to resistance as price has descended through them.
On the downside, immediate support is seen near 140,500. A sustained close below 140,500 would confirm the next leg of bearish pressure and expose 139,000 and 137,500, extending the corrective decline significantly further. The 139,700–139,794 structural levels visible on the chart represent the broader demand reference in that scenario, and sellers retain the dominant near-term position as long as price holds below 142,000 on a closing basis.
Natural Gas futures are currently showing mild positive momentum with a small green candle as price attempts to hold above the ascending trendline from late May. The market has been oscillating within a broad 289–324 range over recent weeks, and the current session reflects buyer interest near the trendline support zone, with the ascending structure continuing to provide a meaningful reference for the ongoing consolidation.
The short-term bias is cautious, with price holding in the 302–310 range without a clear directional resolution. The 314 level now acts as the key near-term resistance trigger, and a decisive close above it would signal renewed bullish conviction and open the path toward 316 and 318. Until that breakout is confirmed on a closing basis, the pattern of lower highs from the June peaks continues to limit upside conviction despite trendline support from below.
On the downside, a sustained close below 305 would confirm a breakdown from the trendline support and invite corrective pressure toward 303 and 301, with the broader 288–290 medium-term demand base acting as the significant structural reference in that scenario. Buyers need to defend 305 on a closing basis to preserve the cautious near-term structure.
Silver Futures extending the extraordinary corrective decline that has taken price from the May highs near 300,000 all the way to fresh multi-month lows near 211,000–215,000. The descending trendline visible on the chart continues to press price lower, with each attempted recovery over recent weeks being met with renewed selling, and the candle sequence reflecting a near-uninterrupted slide with no meaningful buyer participation at any prior support level.
The short-term bias is firmly bearish, with price having broken below the 218,000–221,000 support zone and the descending trendline maintaining consistent overhead pressure. The 218,000 level now acts as the key near-term barrier, and a decisive close above it would be the minimum requirement to begin challenging the prevailing bearish structure and signal any meaningful near-term recovery toward 220,500 and 223,000. Until that reclaim is confirmed convincingly, any bounce is likely to attract fresh selling near the resistance zone.
On the downside, immediate support is seen near 211,000. A sustained close below 211,000 would confirm the continuation of the bearish phase and expose 208,500 and 206,000, extending the decline from the May highs into increasingly distressed territory. Sellers retain the decisive near-term advantage, and the descending trendline continues to be the dominant structural feature of the current price action.
Do you have a question? Ask here and we’ll publish the information in the coming weeks.
Top Blogs of the Week!

Slippage in Trading: Meaning, Causes and Market Impact
Slippage in trading is one of those market realities that every active trader notices sooner or later, often at the worst possible moment. You place an order with one price in mind, but the trade executes at a different price because the market moved in the milliseconds between transmission and execution.

Fake Breakouts Explained: Identification and Market Dynamics
A fake breakout is one of the most frustrating experiences for a retail breakout trader. You watch an asset price consolidate for days, witness a high-momentum candle pierce key resistance, buy the breakout aggressively, and instantly find yourself trapped as the price reverses and crashes back inside the range.
N Coins Rewards

Refer your Friends & Family and GET 500 N Coins.
Do You Find This Interesting?

DISCLAIMER: Investment in securities market are subject to market risks, read all the related documents carefully before investing. The securities quoted are exemplary and are not recommendatory. Full disclaimer: https://bit.ly/naviadisclaimer.