Navia Weekly Roundup (July 28 – August 01, 2025)
Week in the Review
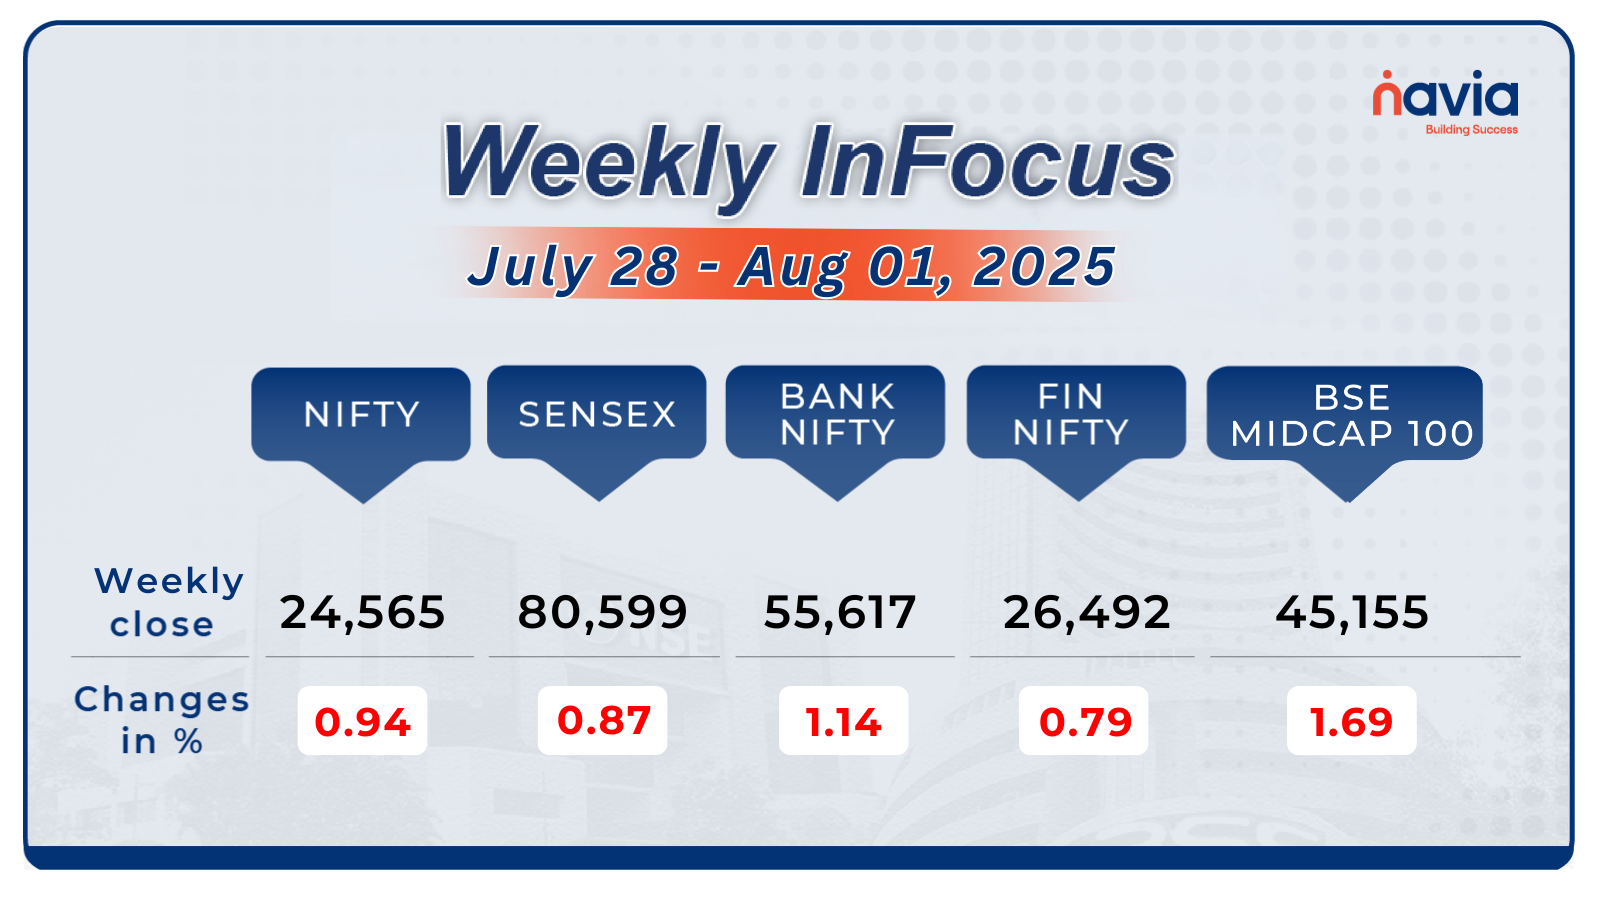
The Indian benchmark indices extended the fall in fifth consecutive week, recording the longest weekly losing streak in two years as investors remained worried about Trump’s 25% tariff on India, hawkish Fed signals, mixed Q1 earnings and persistent FII selling.
Indices Analysis

For the week, the BSE Sensex index declined 0.87 percent to end at 80,599, while Nifty50 fell 0.94 percent to close at 24,565.
The BSE Large-cap Index fell 1.2 percent. Losers included SBI Cards & Payment Services, Indus Towers, Kotak Mahindra Bank, Waaree Energies, DLF, Adani Enterprises, Wipro, Vedanta, while gainers were Varun Beverages, Avenue Supermarts, Bosch, Jio Financial Services, Larsen & Toubro, Hindustan Unilever.
BSE Mid-cap Index fell 1.8 percent. Losers included Godrej Properties, Relaxo Footwears, Bandhan Bank, Premier Energies, Steel Authority of India, Vedant Fashions, Rail Vikas Nigam, Petronet LNG, Zee Entertainment Enterprises. However, gainers were New India Assurance Company, Coromandel International, MphasiS, Go Digit General Insurance, Jindal Stainless, Procter and Gamble Hygiene and Health Care, Thermax, Page Industries.
The BSE Small-cap index shed 2.5 percent with Home First Finance Company India, Zen Technologies, Paras Defence and Space Technologies, Redington, Five-Star Business Finance, SML Isuzu, Kitex Garments, Faze Three, Blue Dart Express, Sportking India, Sindhu Trade Links, Indo Tech Transformers, Mangalore Refinery and Petrochemicals, Himatsingka Seide falling between 10-17 percent. On the other hand, Jayaswal Neco Industries, Saurashtra Cement, Vimta Labs, Advait Energy, CarTrade Tech, Bliss GVS Pharma, Sudarshan Chemical Industries gained between 15-24 percent.
The Foreign Institutional Investors (FIIs) extended their selling in fifth consecutive week, as they sold equities worth Rs 20,524.42 crore, however, Domestic Institutional Investors (DII) continued their buying in 15th week, as they bought equities worth Rs 24,300.05 crore.
Interactive Zone!
Test your knowledge with our Markets Quiz! React to the options and see how your answer stacks up against others. Ready to take a guess?
Sector Spotlight
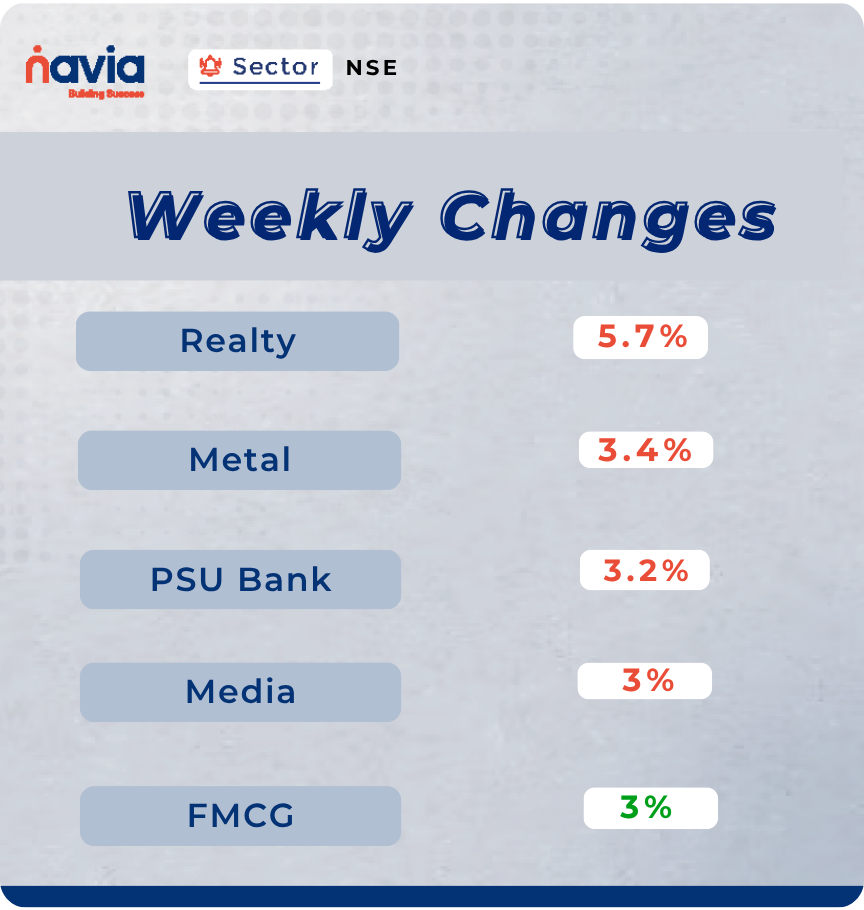
On the sectoral, Nifty Realty index slipped 5.7 percent, Nifty Metal index shed 3.4 percent, Nifty PSU Bank index declined 3.2 percent, Nifty Media index fell 3 percent, however, Nifty FMCG index rose 3 percent.
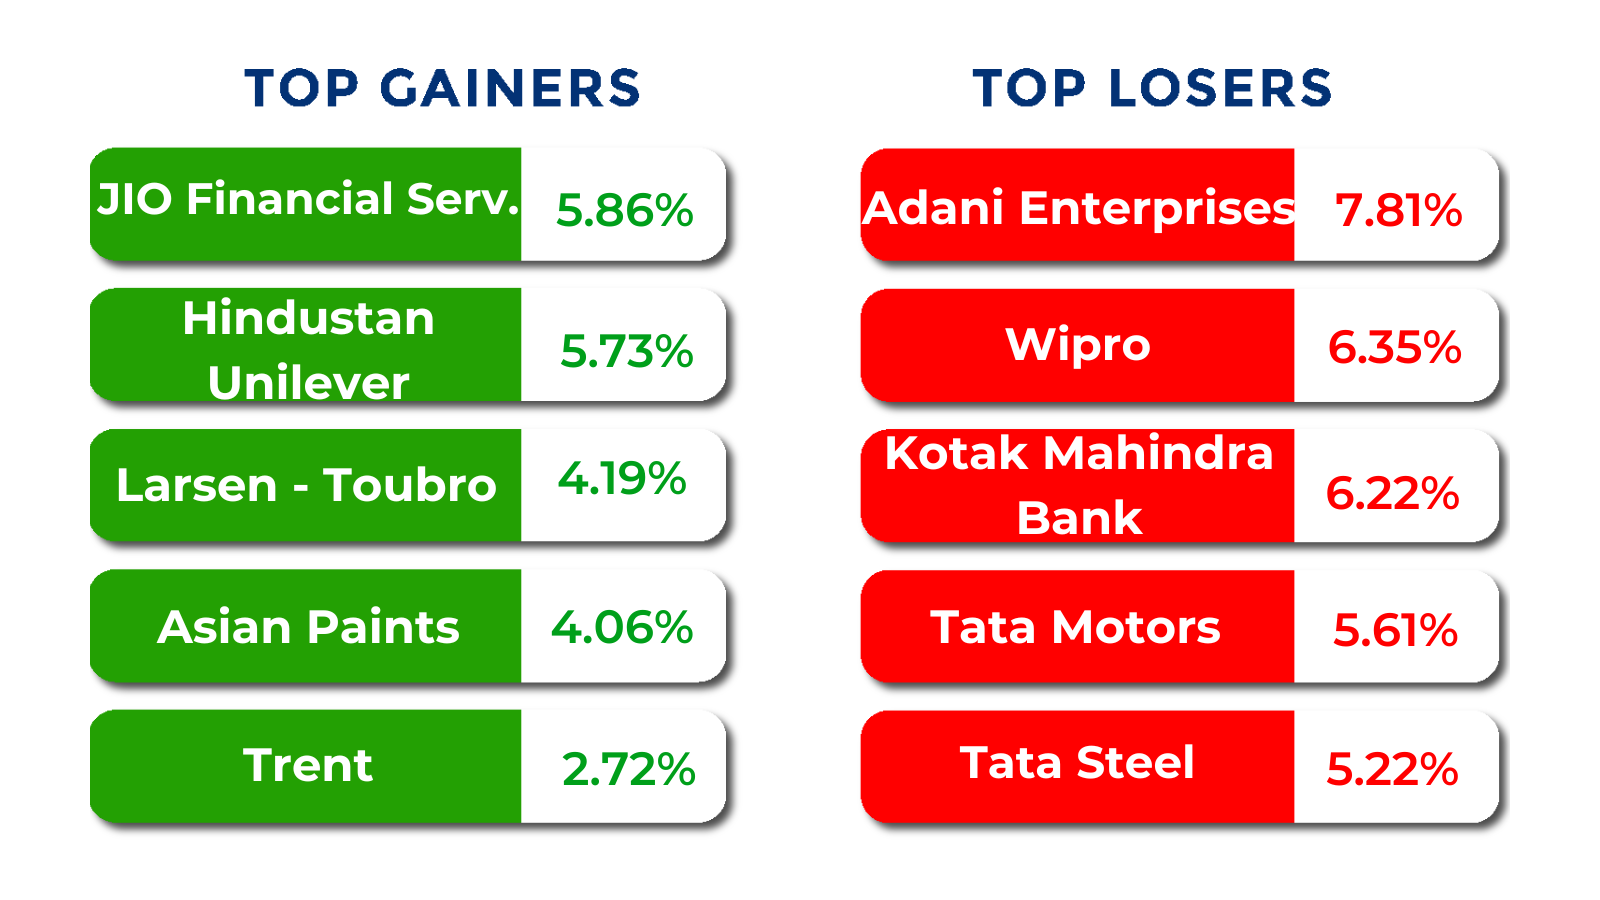
Top Gainers and Losers
Currency Chronicles
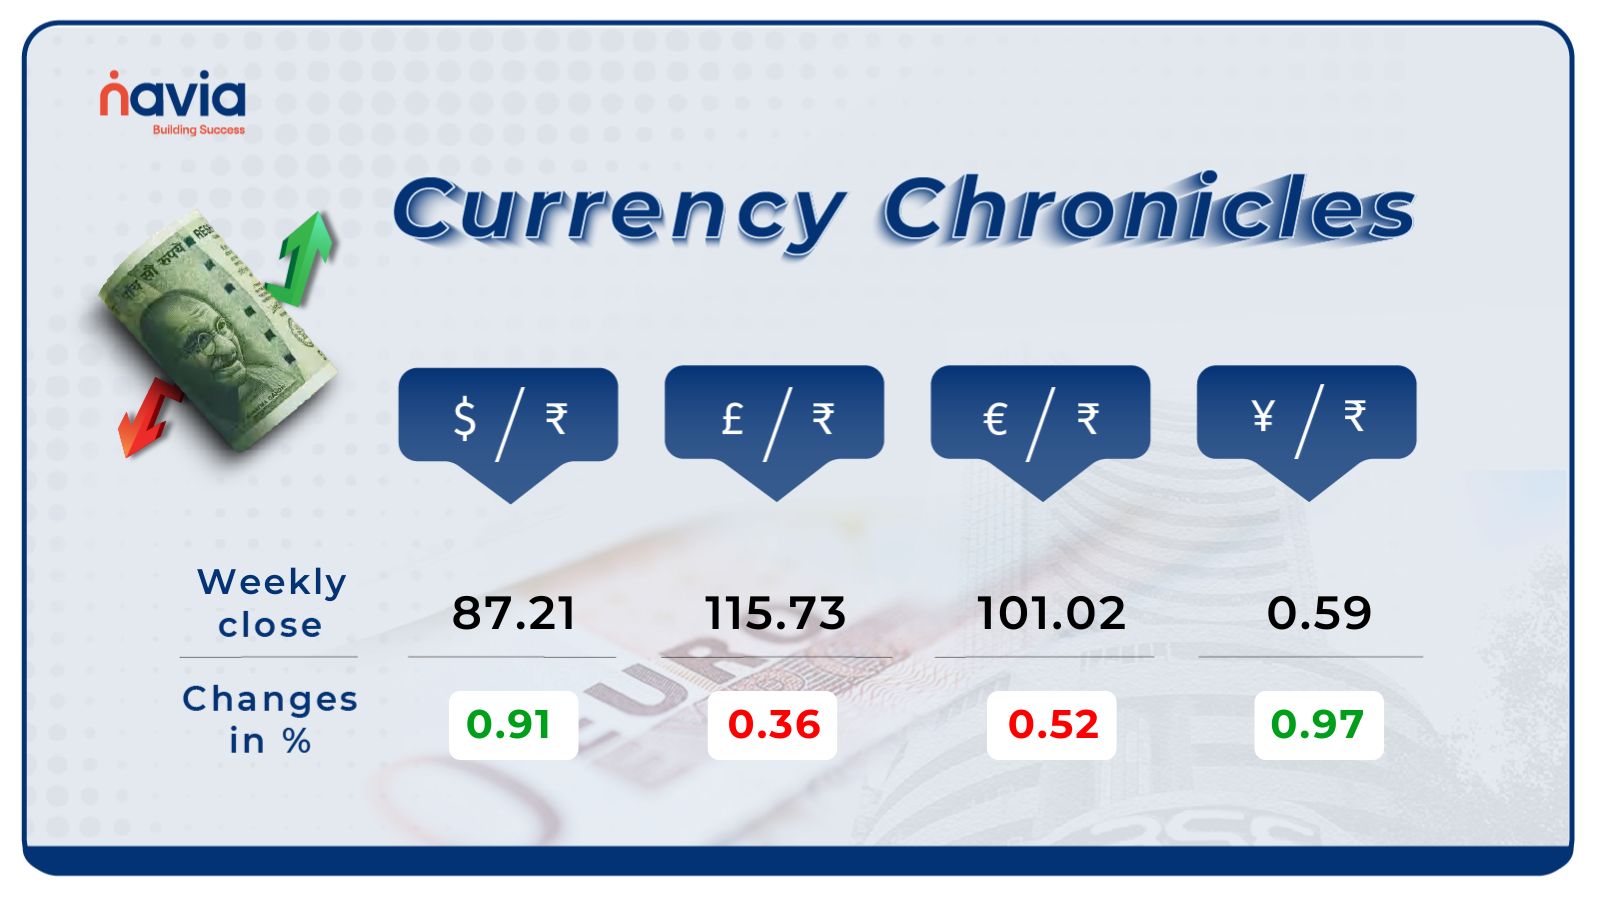
USD/INR:
The USD/INR rate closed at ₹87.21 per dollar, gaining 0.91% during the week, reflecting a bullish market sentiment.
EUR/INR:
The EUR/INR rate closed at ₹101.02 per euro, losing 0.52% during the week, reflecting a bearish market sentiment.
JPY/INR:
The JPY/INR rate closed at ₹0.59 per yen, gaining 0.97% during the week, reflecting a bullish market sentiment.
Stay tuned for more currency insights next week!
Commodity Corner
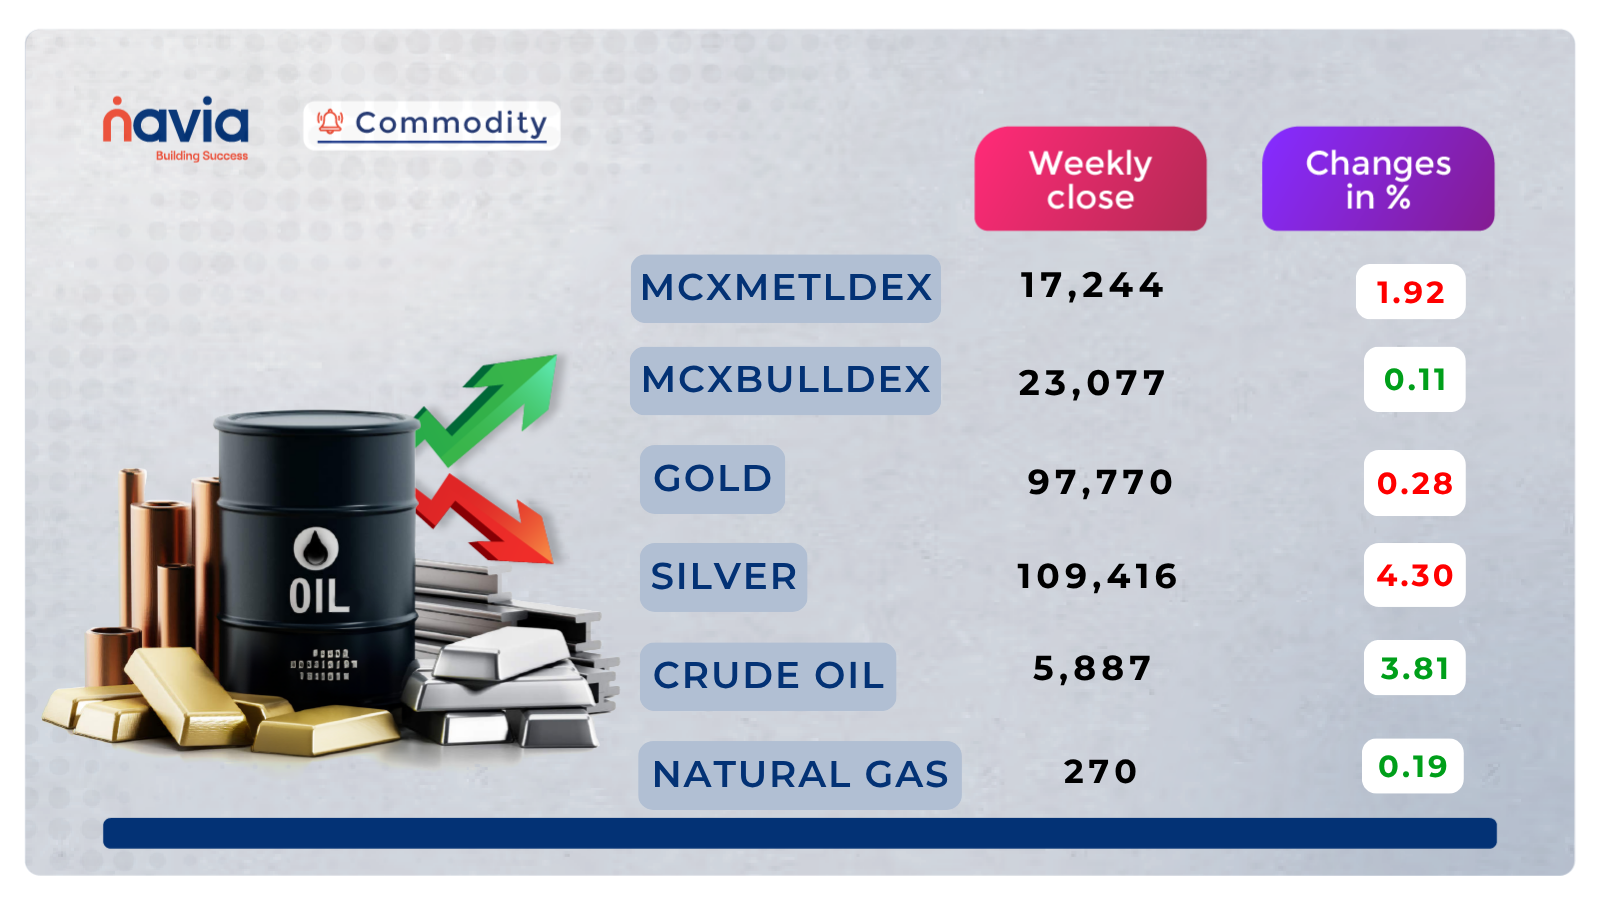
Crude Oil closed at 5,887. Sustained above the breakout zone of 5,914 and continues to trade inside a rising wedge pattern, approaching its upper boundary. The price faced mild rejection near 6,090, signaling some supply pressure at higher levels. Momentum remains bullish, but unless 6,200 is cleared decisively with volume, further upside may pause. The zone between 6,370 and 6,465 remains a major supply area, where selling has occurred in the past. Immediate support lies at 5,914, and a breakdown below 6,115 may invite short-term profit booking.
Gold closed at 97,770. Moved upward after bouncing from support near 97,680 and are now testing the key resistance zone at 98,850–99,000. Price action is showing hesitation, indicating strong supply pressure around this zone. If the price breaks above 98,930 with strong volume, it may confirm a bullish breakout toward higher targets. However, failure to break convincingly may result in a correction back to trendline and support areas. The rising trendline (black) provides dynamic support. If 98,390 breaks, then further downside may open toward 97,680–97,151 again.
Natural Gas last session closed at 270. The price broke back into the 271.2–272.5 band, which previously acted as a resistance zone and now flips to support. Upward momentum is visible, but the overall trend remains under a descending resistance line, with a major supply zone between 277.5–278. Unless the price breaks and sustains above 277.5 with volume, upside is likely to remain capped. Natural Gas is testing support near 271.2. A sustained move above this zone would indicate bullish strength, while a breakdown below 266.7 may signal downside.
Do you have a question? Ask here and we’ll publish the information in the coming weeks.
Top Blogs of the Week!

Electricity Futures: A New Trading Opportunity
Electricity futures have recently been introduced on MCX, providing market participants a new hedging instrument.

How to Read the Annual Report of a Company?
Annual reports contain insights into a company’s health, strategy, and risks. Learning to interpret them can support informed investment research.
N Coins Rewards

Refer your Friends & Family and GET 500 N Coins.
Do You Find This Interesting?

DISCLAIMER: Investments in securities market are subject to market risks, read all the related documents carefully before investing. The securities quoted are exemplary and are not recommendatory. Full disclaimer: https://bit.ly/naviadisclaimer.