Navia Weekly Roundup (July 14 – 18, 2025)
Week in the Review
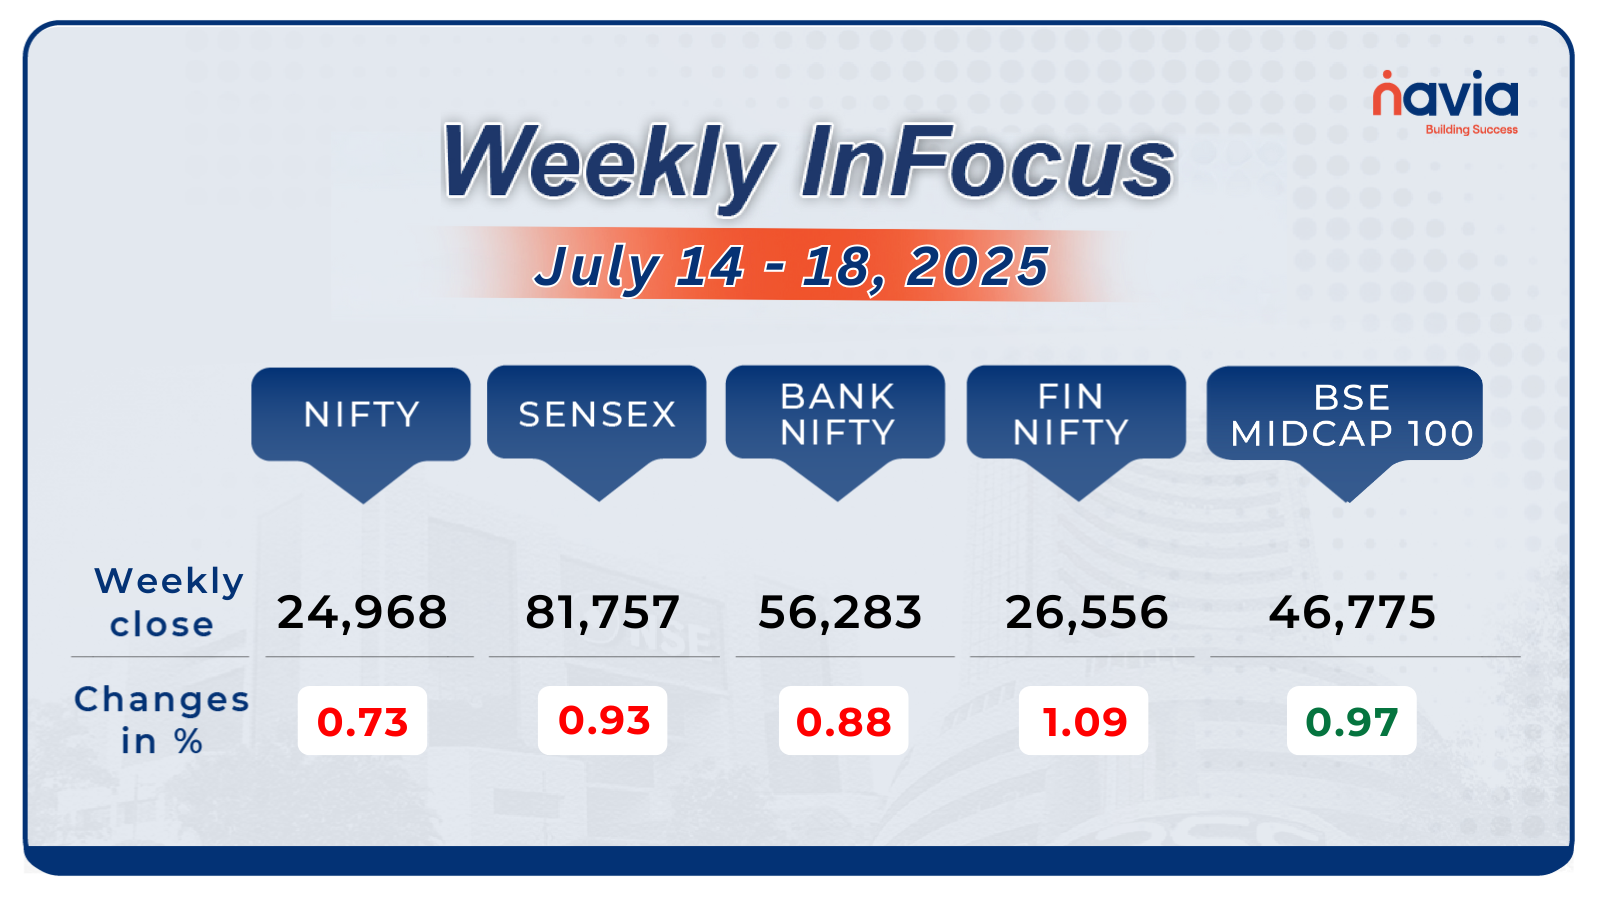
The Indian market continued the correction in the third consecutive week amid heavy foreign institutional selling, tepid corporate earnings from IT and banks, uncertainties in trade agreement with US. However, market ignored above normal monsoon, 77-month low inflation and soft wholesale inflation.
Indices Analysis
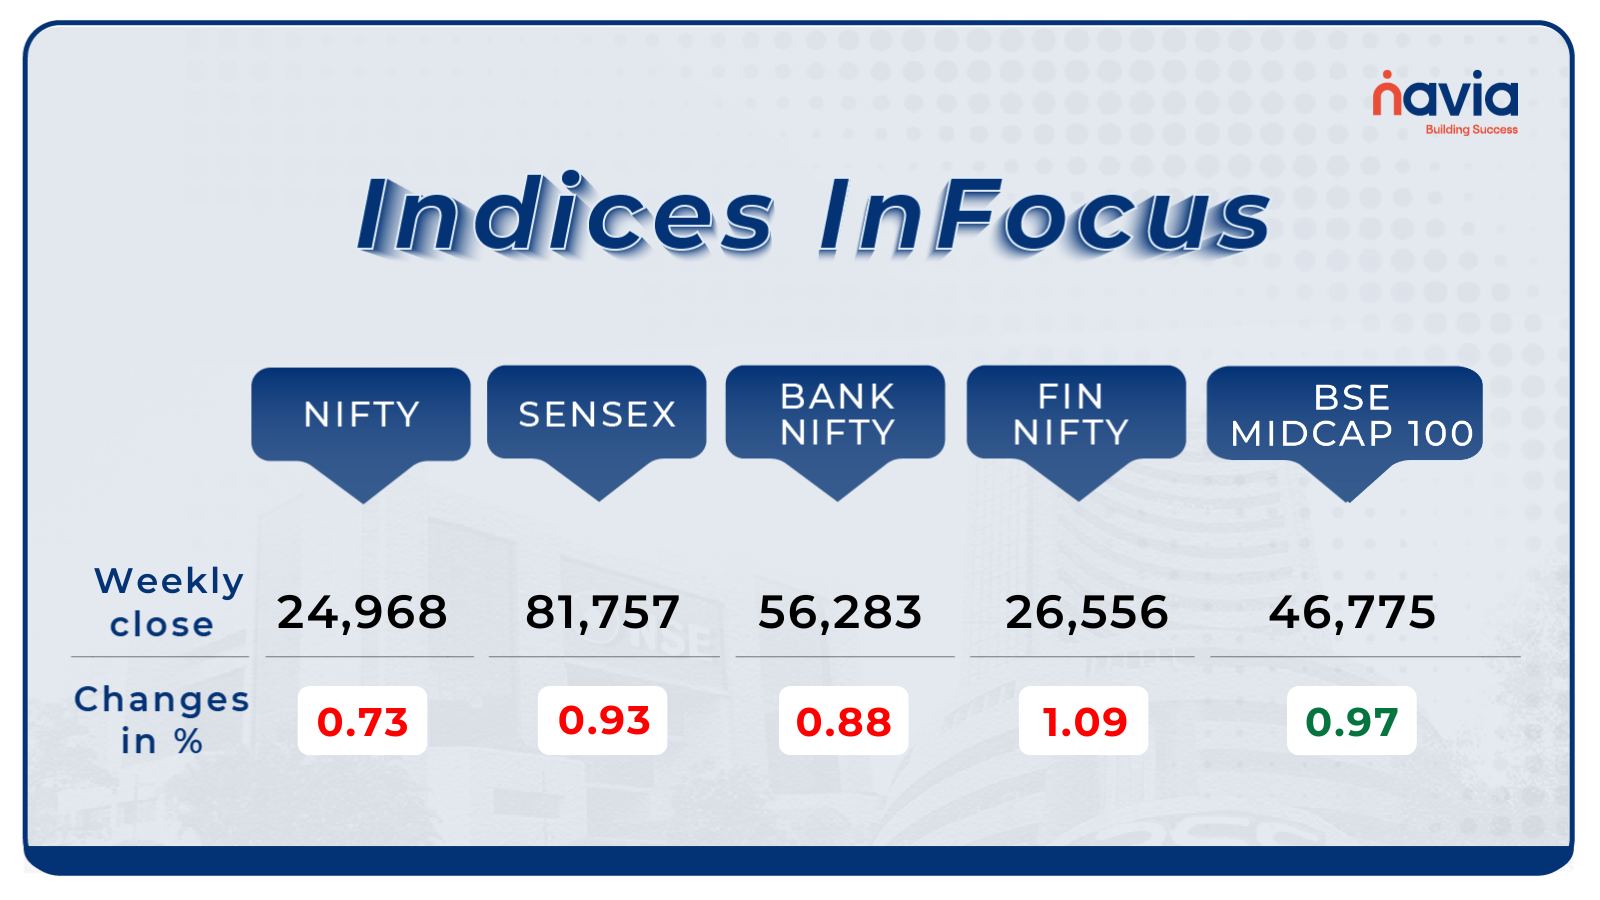
For the week, the BSE Sensex index shed 0.93 percent to close at 81,757, and Nifty50 fell 0.73 percent to close at 24,968.
The BSE Large-cap Index shed 0.5 percent. Top losers were HCL Technologies, ICICI Lombard General Insurance Company, ICICI Prudential Life Insurance Company, Tech Mahindra, Jio Financial Services, Kotak Mahindra Bank, Interglobe Aviation, ABB India. However, gainers were Varun Beverages, HDFC Asset Management Company, Bosch, Hero MotoCorp, Adani Green Energy.
BSE Mid-cap Index erased previous week losses and ended with a percent gain with Patanjali Foods, Thermax, Piramal Enterprises, Sona BLW Precision Forgings, Gland Pharma, Biocon, Ajanta Pharma, UPL, Godrej Properties gaining between 6-14 percent.
The BSE Small-cap index rose 1.5 percent with LE Travenues Technology (IXIGO), Igarashi Motors, Navkar Corporation, John Cockerill India, Neuland Laboratories, Anand Rathi Wealth, Platinum Industries, Tilaknagar Industries, Sportking India, Allcargo Terminals, Godavari Biorefineries, Ashapura Minechem rising 15-22 percent.
During the week, HCL Technologies lost the most in terms of market value, followed by Reliance Industries, Tata Consultancy Services, Kotak Mahindra Bank. On the other hand, State Bank of India, Mahindra and Mahindra, ITC added the most of their market-cap.
Interactive Zone!
Test your knowledge with our Markets Quiz! React to the options and see how your answer stacks up against others. Ready to take a guess?
Sector Spotlight
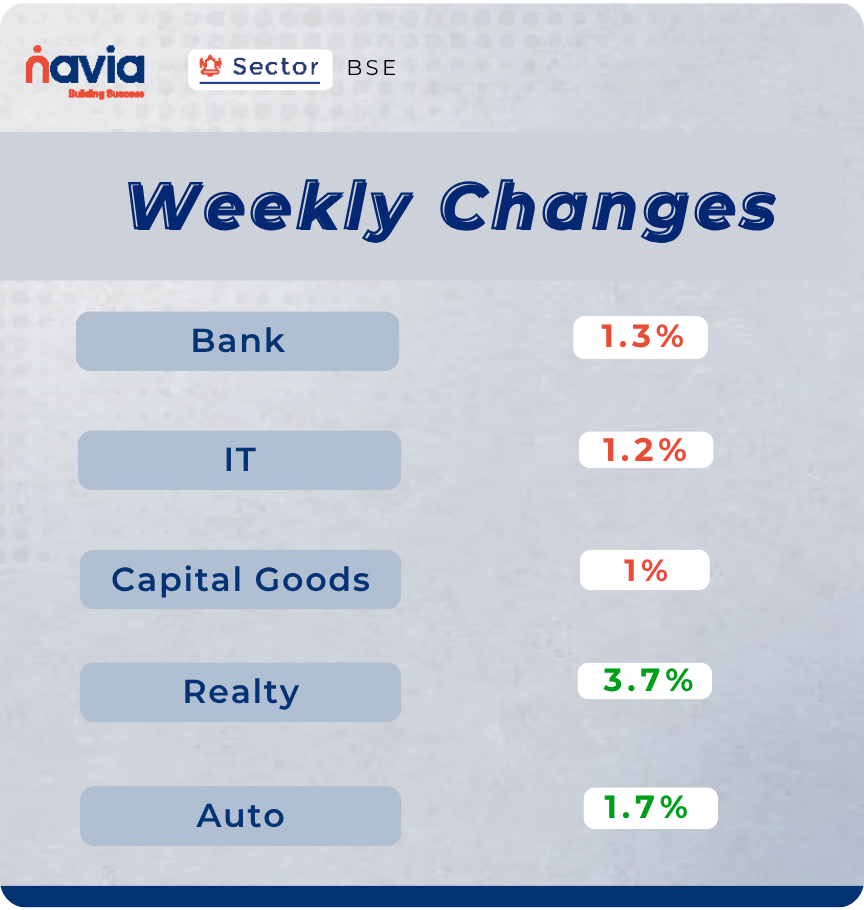
On the sectoral, BSE Bank index fell 1.3 percent, BSE Information Technology index shed 1.2 percent, BSE Capital Goods index shed 1 percent. On the other hand, BSE Realty index added 3.7 percent, BSE Auto index rose 1.7 percent.
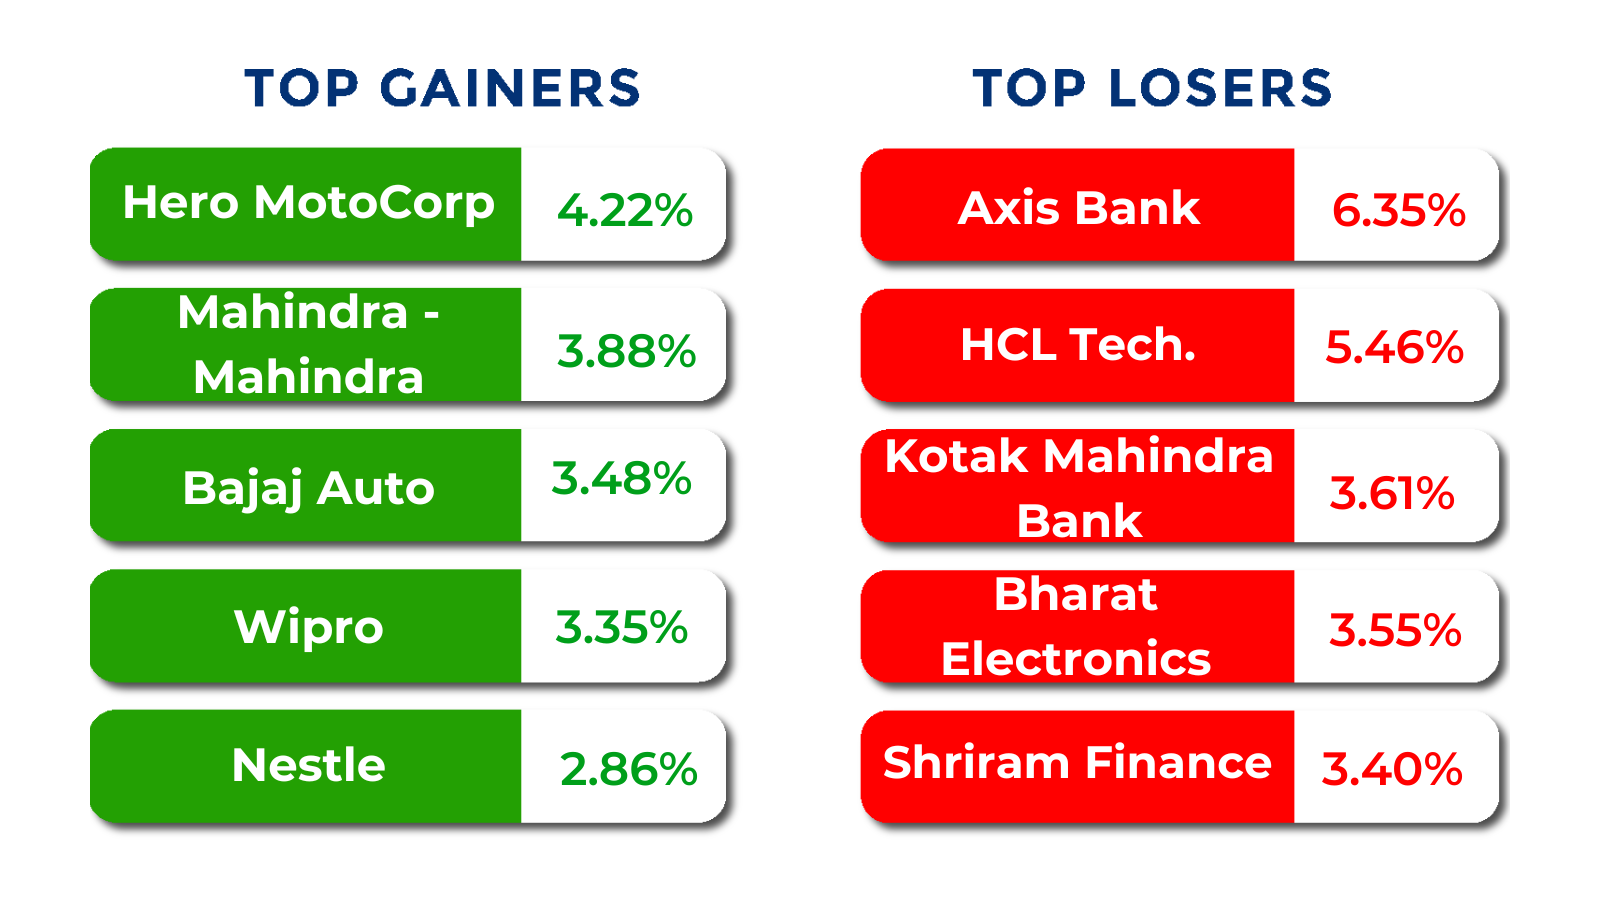
Top Gainers and Losers
Currency Chronicles
USD/INR:
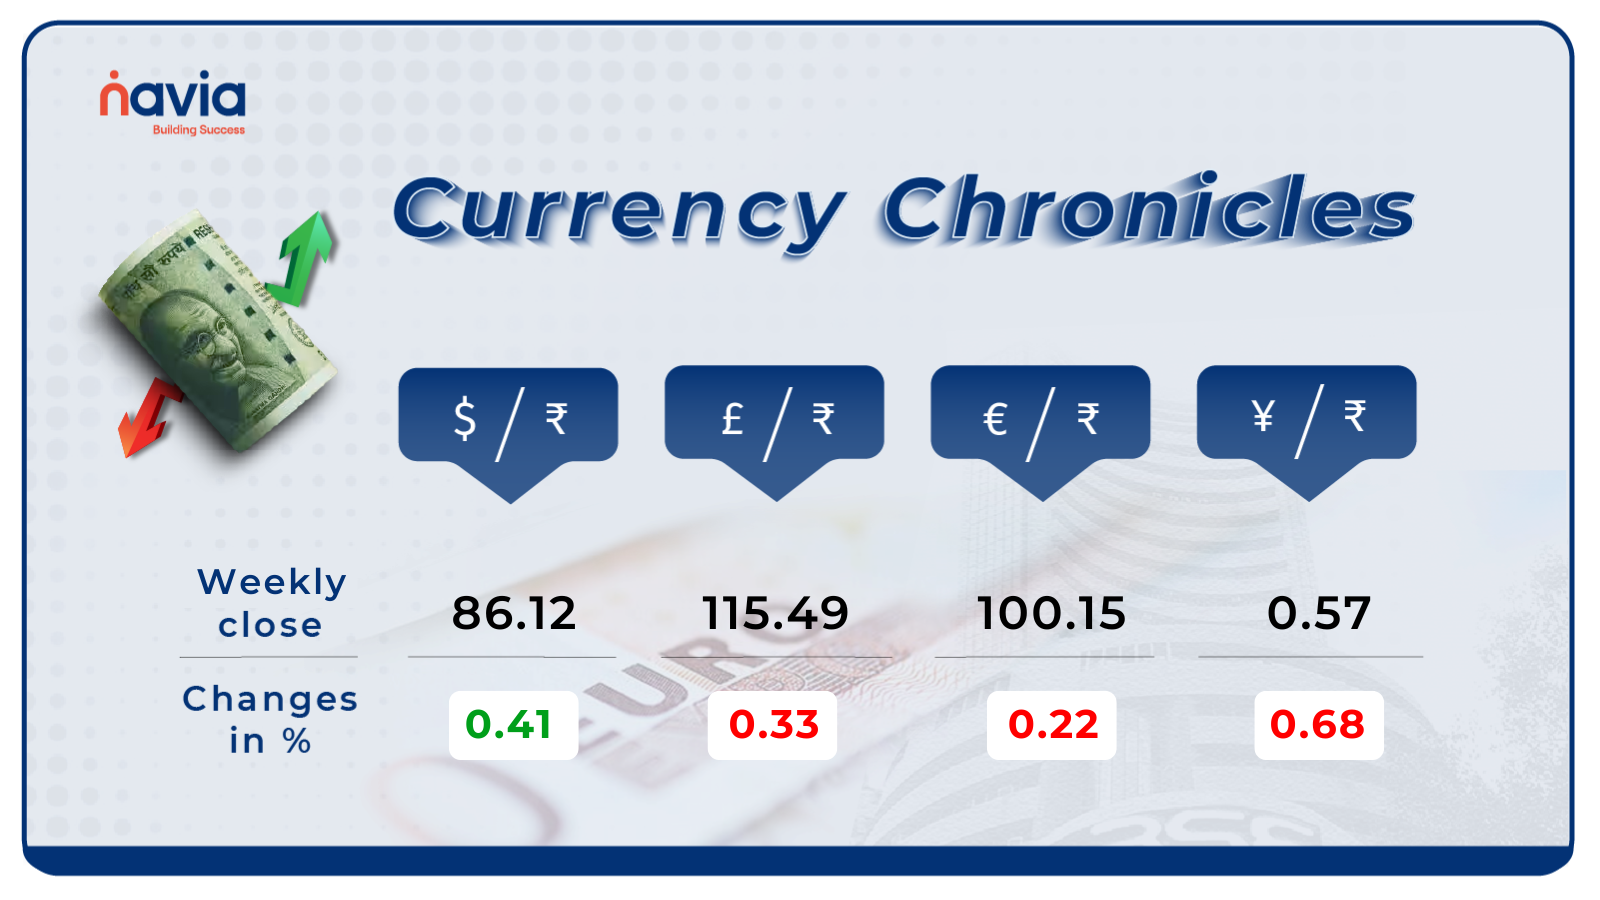
The USD/INR rate closed at ₹86.12 per dollar, gaining 0.41% during the week, reflecting a bullish market sentiment.
EUR/INR:
The EUR/INR rate closed at ₹100.15 per euro, losing 0.22% during the week, reflecting a bearish market sentiment.
JPY/INR:
The JPY/INR rate closed at ₹0.57 per yen, losing 0.68% during the week, reflecting a bearish market sentiment.
Stay tuned for more currency insights next week!
Commodity Corner
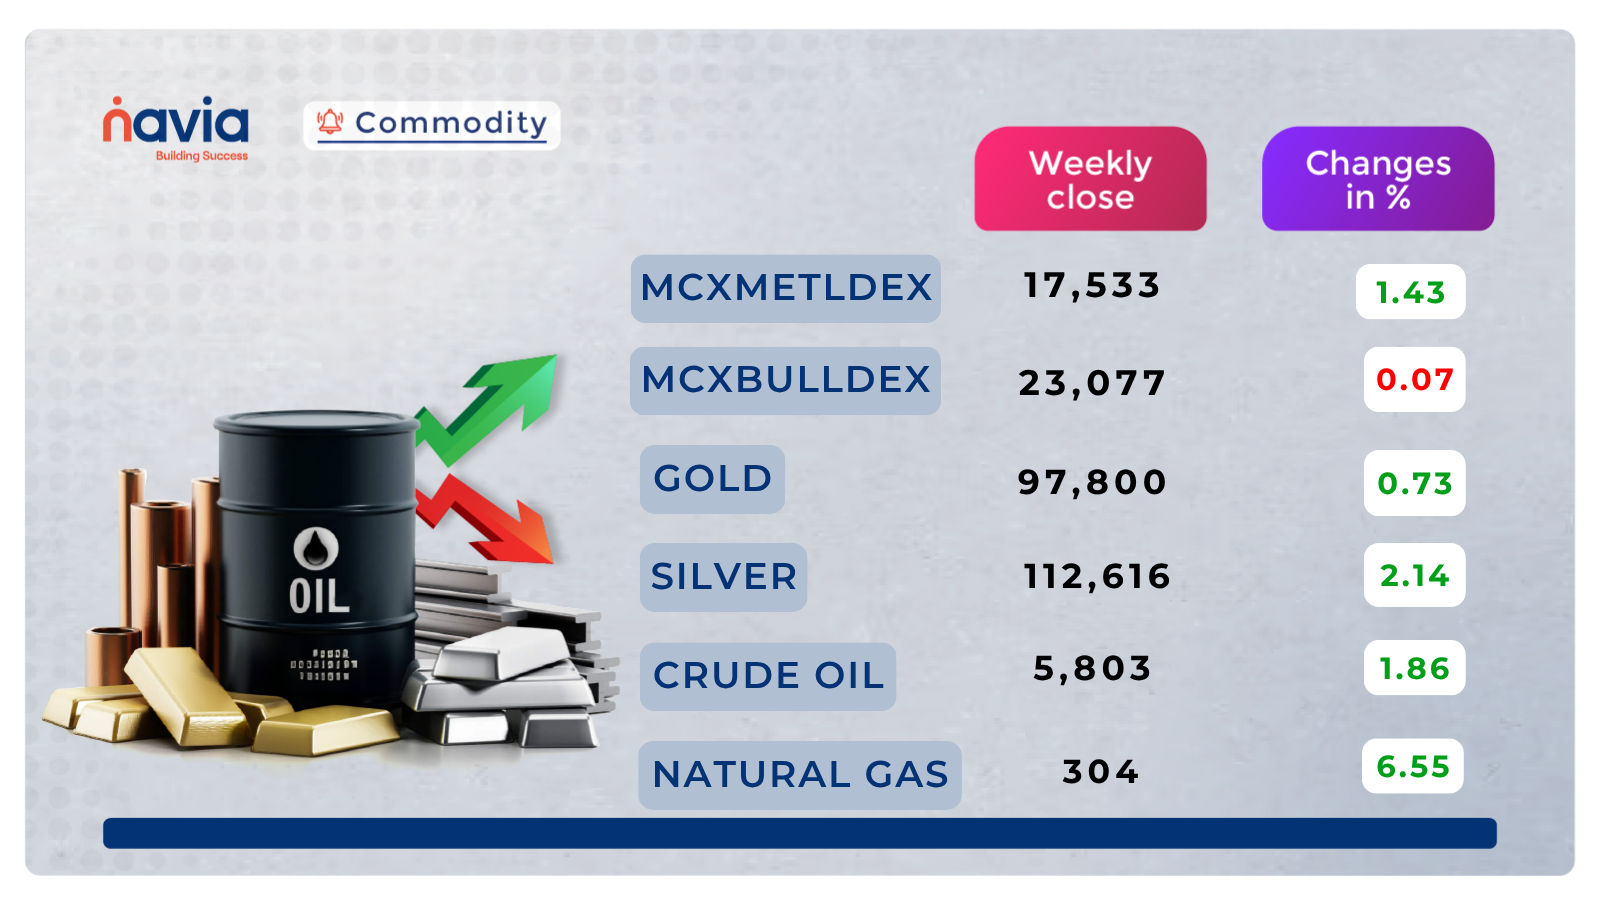
Crude Oil closed at 5,803. On the 1-hour chart, price shows a rejection from the rising channel resistance, failing to sustain above the 5,800 zone. Price is now retesting the immediate support around 5,760. A break below this may lead to a short-term correction, while a strong breakout above 5,810 could resume the bullish structure. RSI is hovering near 60, indicating mild bullish strength with potential for continuation if volumes support a breakout.
Gold closed at 97,800. On the 1-hour chart, price action shows a rejection from the descending trendline, keeping it in a short-term downtrend. However, it is currently trading above multiple horizontal support zones between 97,100–97,300, which could provide near-term buying interest. A breakout above 97,800 may trigger bullish continuation, while a breakdown below 97,000 could extend downside momentum.
Natural Gas closed at 304. On the 1-hour chart, price is showing signs of consolidation near the upper range of the rising wedge pattern. Despite a pullback from the 310 zone, it is holding above the immediate support at 305. A breakdown below 305 may trigger a corrective dip, while a breakout above 310 could extend the bullish momentum toward new short-term highs.
Do you have a question? Ask here and we’ll publish the information in the coming weeks.
Top Blogs of the Week!

What Is Open Interest Analysis & Why It’s a Game-Changer for Options Traders
Go beyond basic charts and discover the game-changing power of Open Interest (OI) analysis for options trading. It demystifies OI, explaining how it differs from volume and, more importantly, how professional traders leverage it. Learn to pinpoint crucial support/resistance, confirm price trends, gauge market sentiment, and even anticipate expiry day moves by understanding where the “smart money” is positioned, explains how traders use OI as a tool to understand market sentiment.
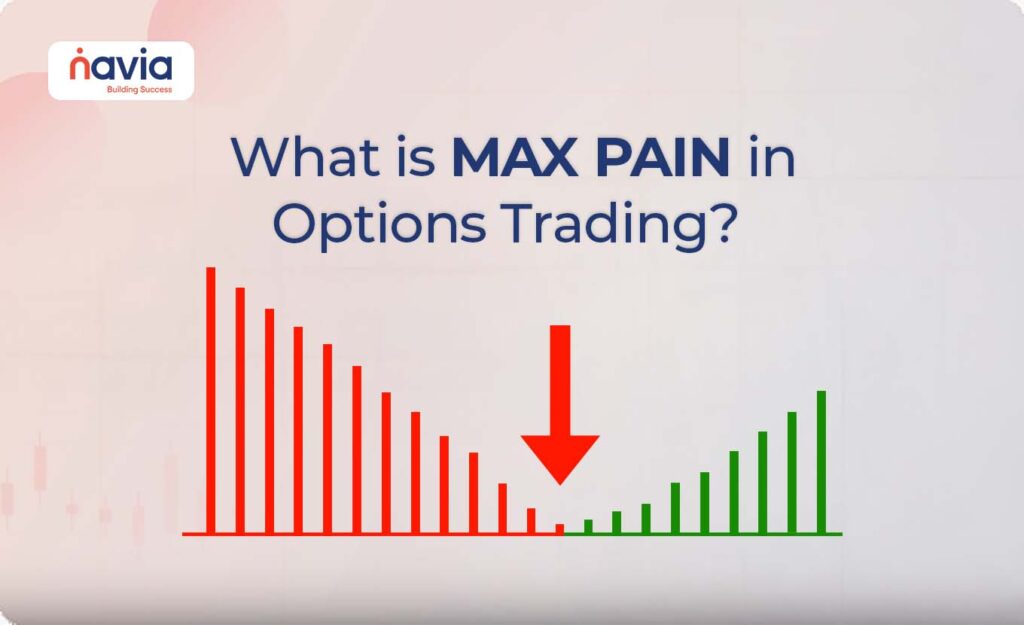
What is Max Pain in Options Trading?
Ever wondered why stock prices gravitate towards specific levels on option expiry? This blog explained about “Max Pain,” the crucial strike price where option buyers face the most loss and, conversely, option sellers (the big institutions) minimize their risk. Learn how this powerful concept acts as a predictive tool for the upcoming expiry in July 2025, reflecting institutional positioning and helping you anticipate market settlements for a smarter options trading strategy.
N Coins Rewards

Refer your Friends & Family and GET 500 N Coins.
Do You Find This Interesting?

DISCLAIMER: Investments in securities market are subject to market risks, read all the related documents carefully before investing. The securities quoted are exemplary and are not recommendatory. Full disclaimer: https://bit.ly/naviadisclaimer.