Navia Weekly Roundup (Jan 05 – 09 2026)
- Week in the Review
- Indices Analysis
- Interactive Zone!
- Sector Spotlight
- Top Gainers and Losers
- Currency Chronicles
- Commodity Corner
- Top Blogs of the Week!
- N Coins Rewards
Week in the Review
Indian equity indices experienced a notable decline during the week ending January 9, 2026, marking their one of the weaker weekly performances in over three months. The benchmark Nifty 50 and Sensex fell for five consecutive sessions, decline in market capitalization.
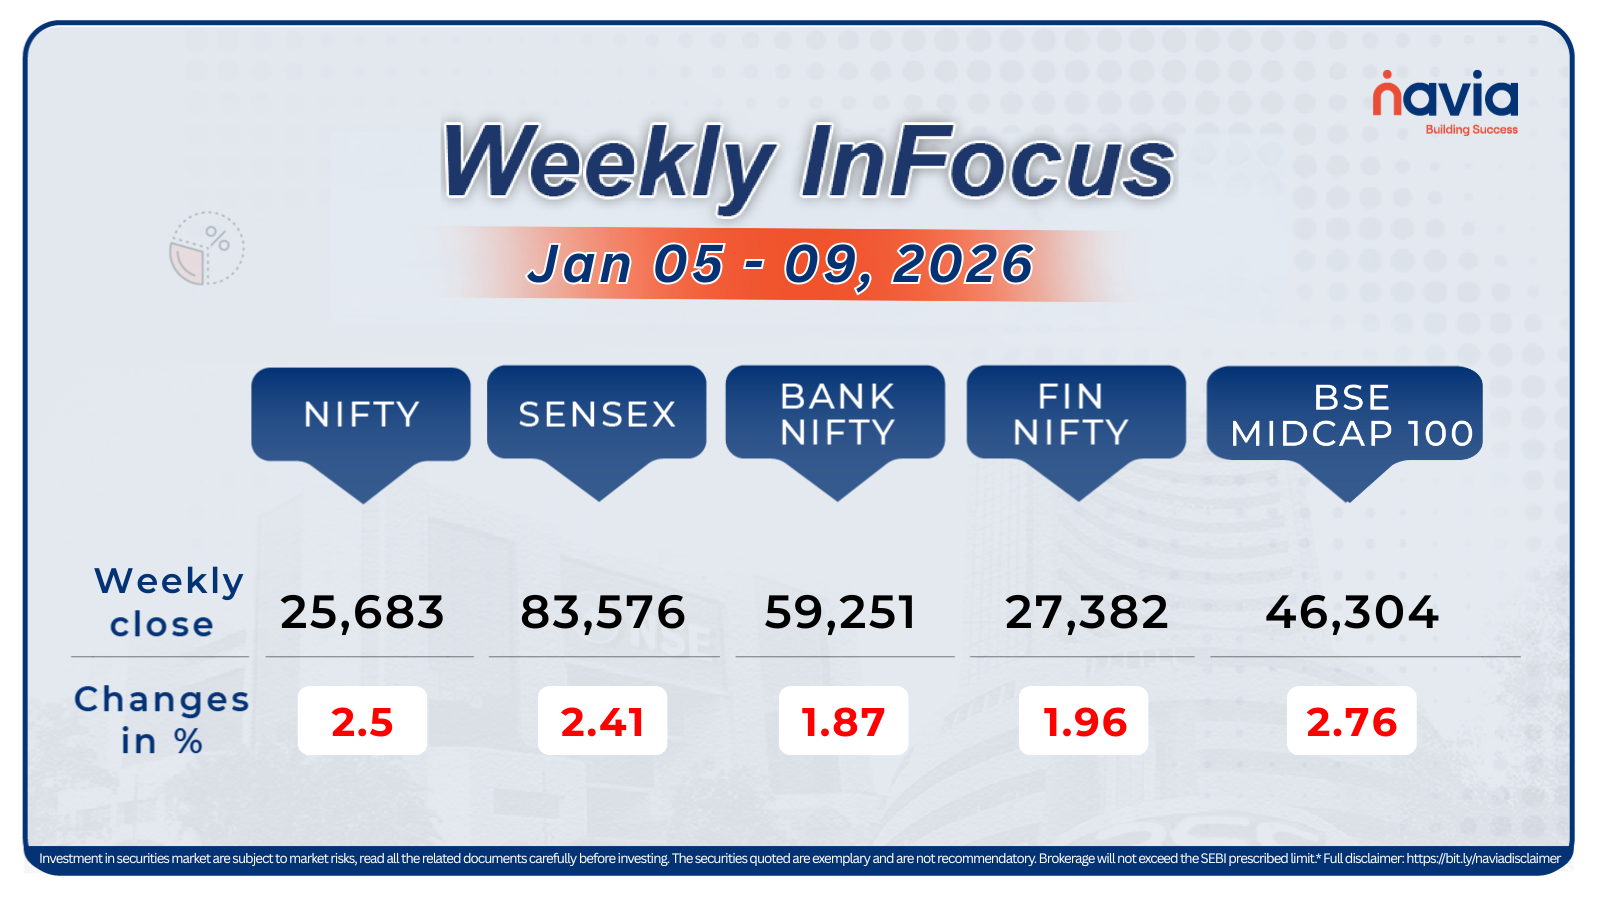
Indices Analysis
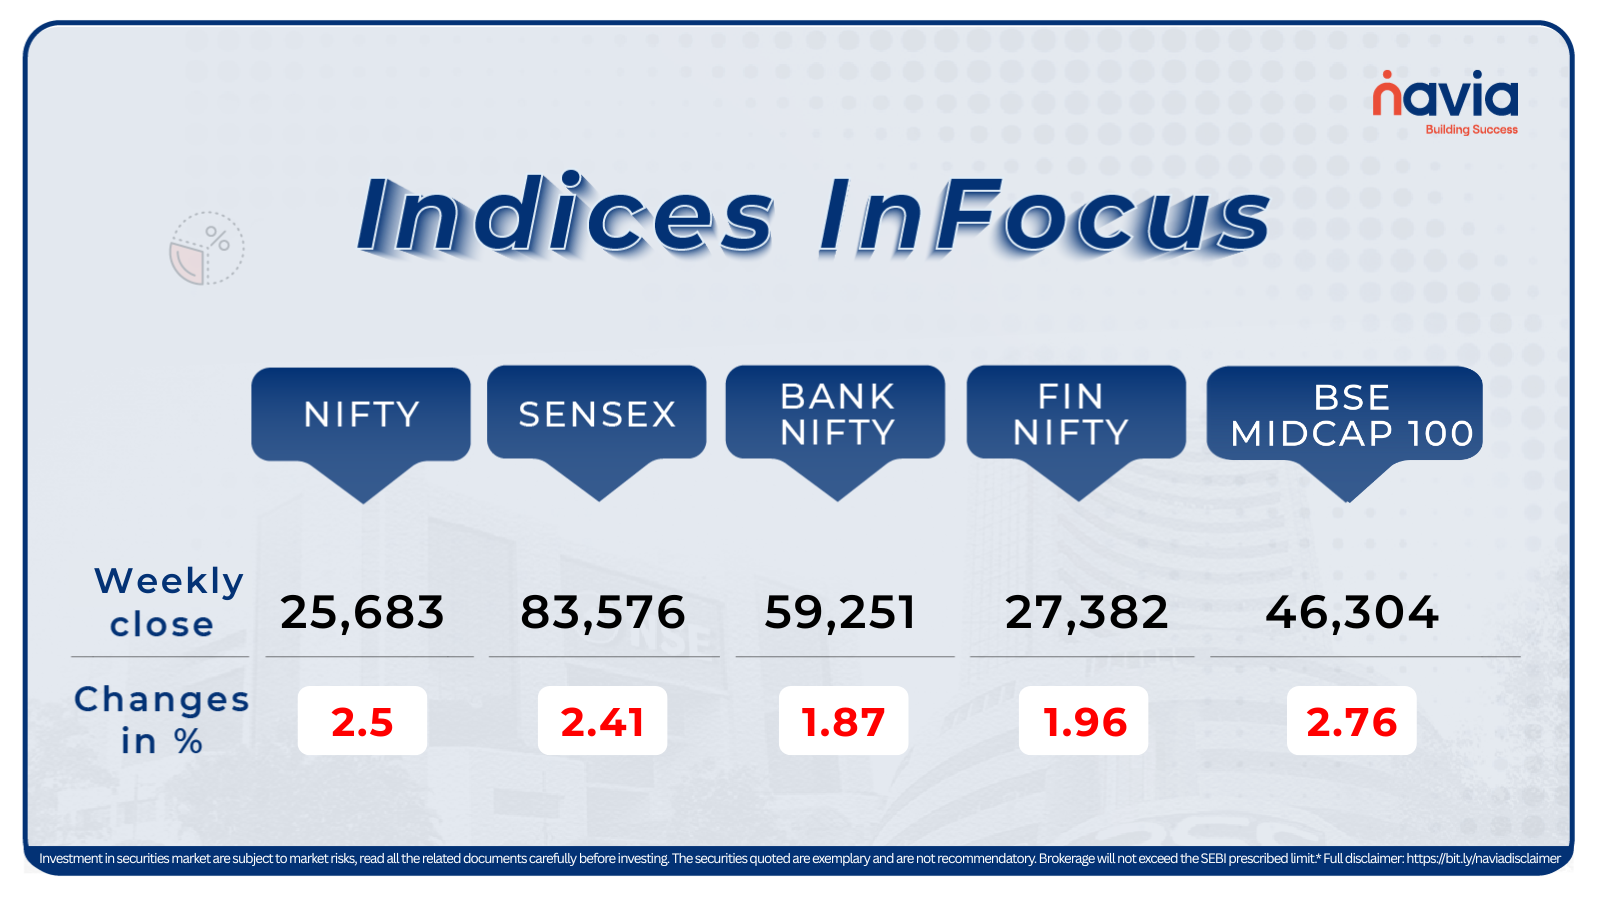
BSE Sensex index decrease 2.41 percent at 83,576, while Nifty50 index lose 2.5 percent at 25,683.
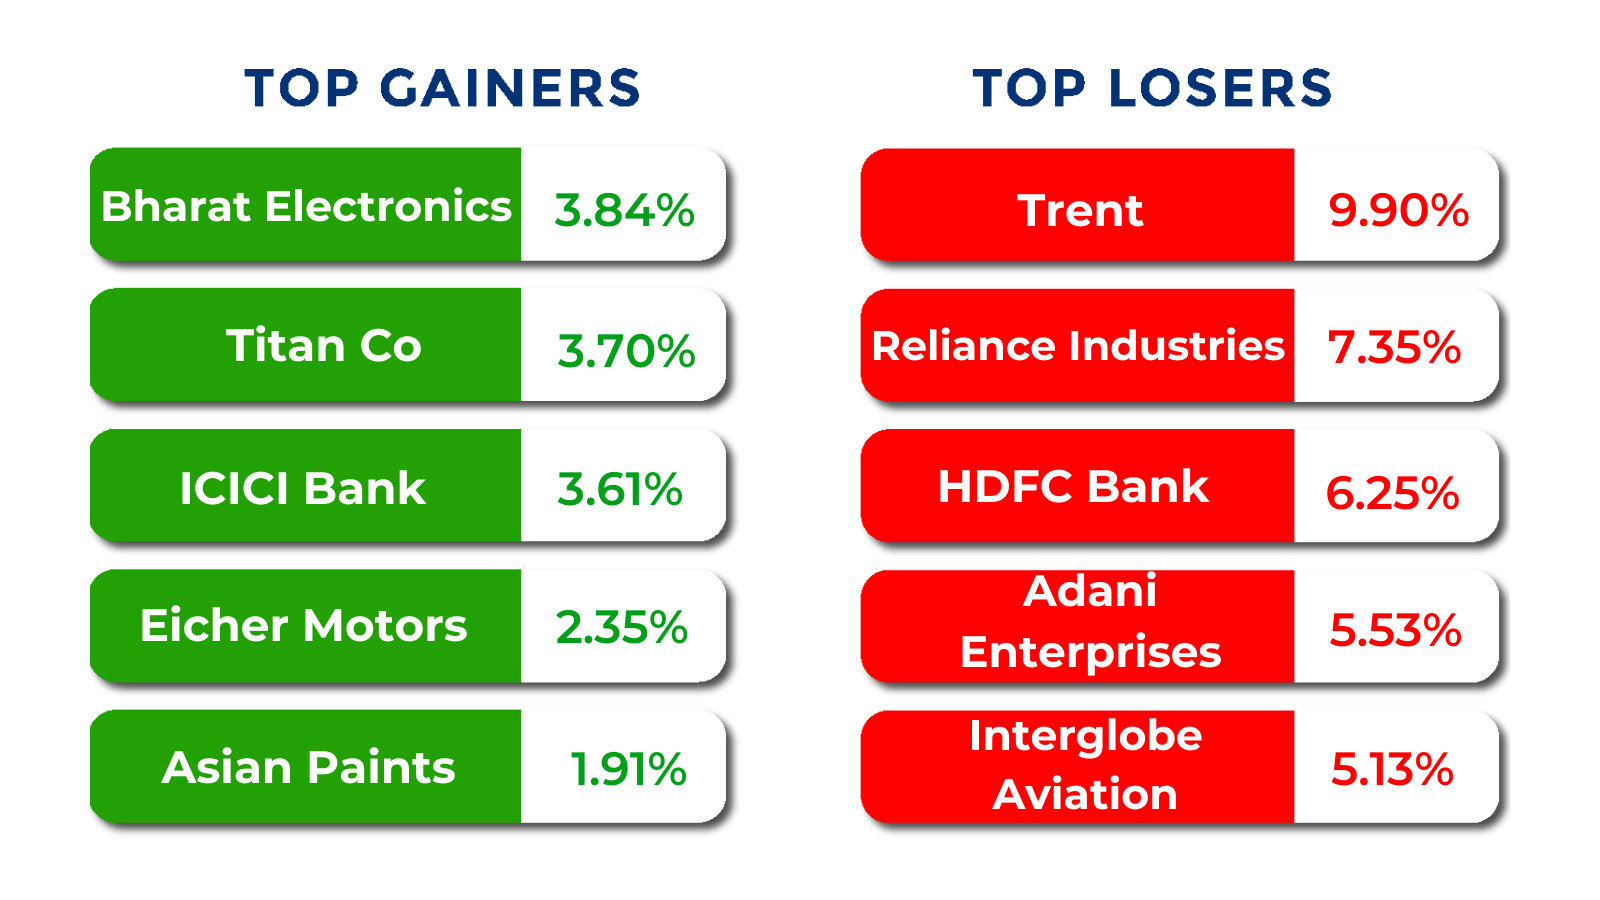
The BSE Large-cap Index declined 2.5 percent over the week, decline due to price movement in stock such as in Waaree Energies, IDBI Bank, Trent, Swiggy, and Adani Energy Solutions. On the other hand, stocks such as Solar Industries India, Bharat Electronics, Titan Company, ICICI Bank, Lupin, Divi’s Laboratories, and Union Bank of India closed higher.
The BSE Mid-cap Index declined 2.6 percent during the week, decline due to price movement in stock such as in Premier Energies, Mahindra & Mahindra Financial Services, Jindal Stainless, Suzlon Energy, Hindustan Petroleum Corporation, and Rail Vikas Nigam. Meanwhile, select stocks such as Ipca Laboratories, Emcure Pharmaceuticals, Tata Elxsi, CRISIL, and National Aluminium Company performed differently from the broader market to end higher.
The BSE Small-cap index declined nearly 4 percent during the week, with declines observed across several stocks. Shares of Systematix Corporate Services, Balu Forge Industries, Worth Investment & Trading, VTM, Kiri Industries, Sai Silks Kalamandir, Indian Metals & Ferro Alloys, Transformers and Rectifiers India, Stallion India Fluorochemicals, Wardwizard Innovations and Mobility, Baazar Style Retail, Elecon Engineering Company, Kitex Garments, Faze Three, and Sandur Manganese and Iron Ores decline between 15% and 23%.
Foreign Institutional Investors (FIIs) continued to remain net sellers during the week, offloading equities worth Rs 9,209.90 crore. In contrast, Domestic Institutional Investors (DIIs) were net buyers, purchasing equities worth Rs 17,594.58 crore.
Interactive Zone!
Test your knowledge with our Markets Quiz! React to the options and see how your answer stacks up against others. Ready to take a guess?
Sector Spotlight
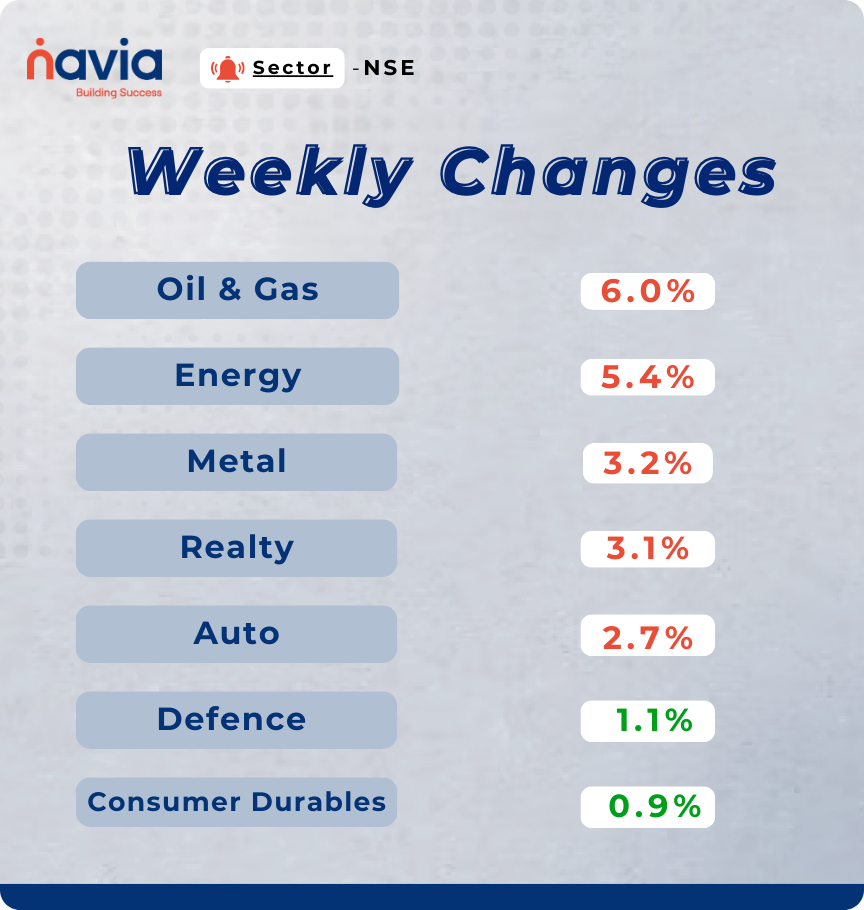
Sectorally, Nifty Oil & Gas, and Nifty Energy indices declined 5-6 percent during the week. Nifty Metal, Realty, and Auto indices also declined, each slipping more than 2 percent. In contrast, the Nifty Defence index gained 1.1 percent, while the Nifty Consumer Durables index rose near 1 percent.
Top Gainers and Losers
Currency Chronicles
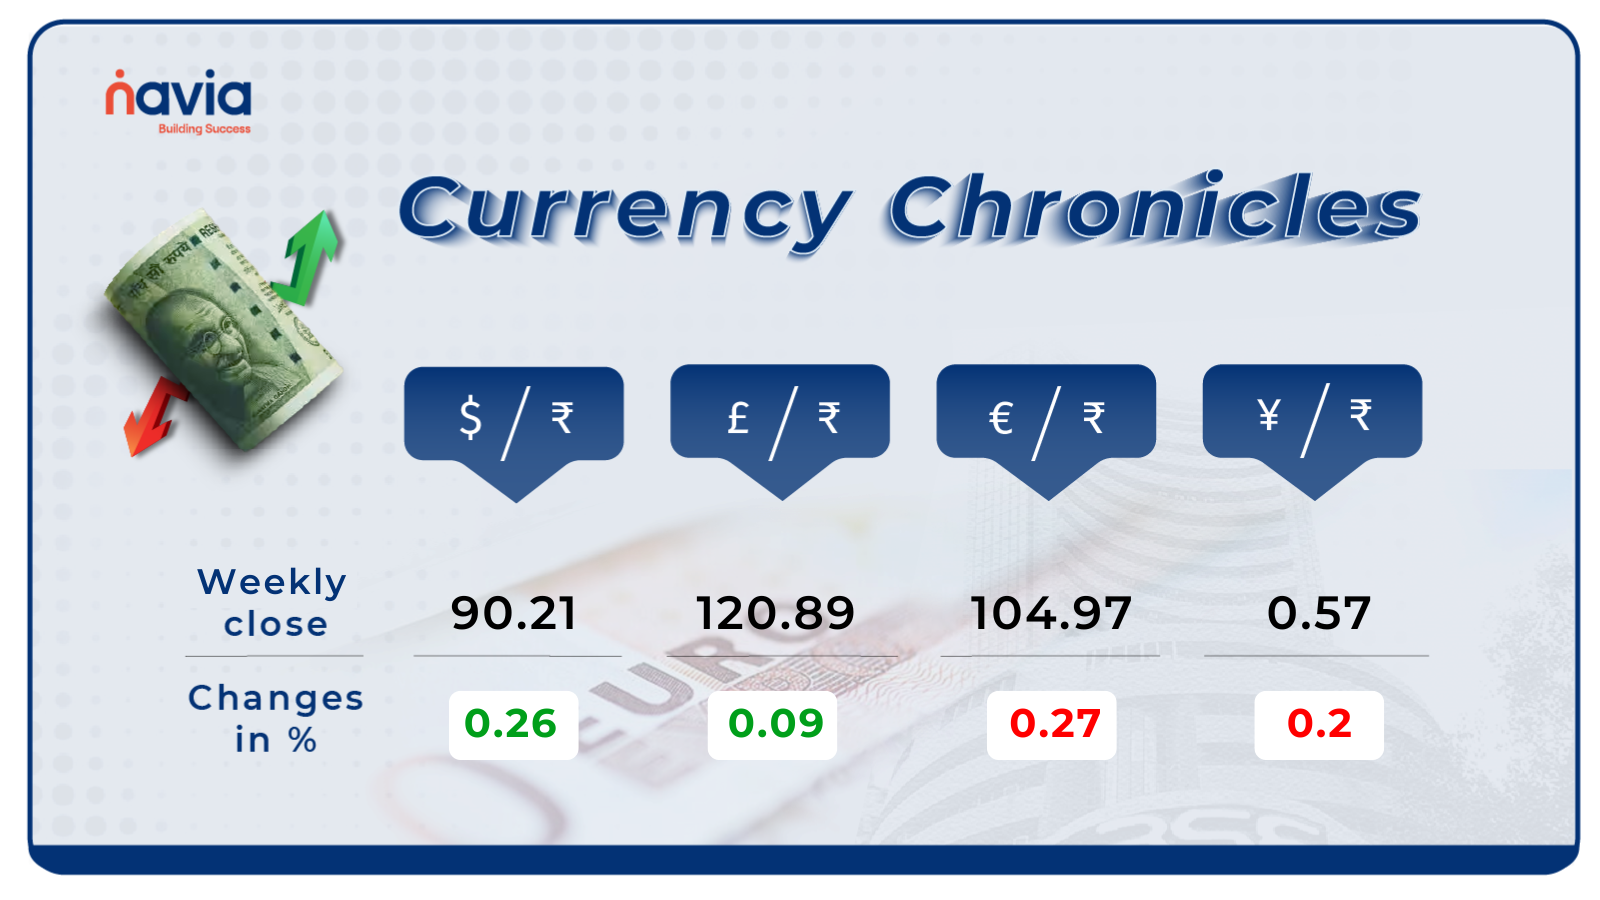
USD/INR:
The USD/INR rate closed at ₹90.21 per dollar, gaining 0.26% during the week, reflecting a reflect upward movement.
EUR/INR:
The EUR/INR rate closed at ₹104.97 per euro, losing 0.27% during the week, reflecting a reflect downward movement.
JPY/INR:
The JPY/INR rate closed at ₹0.57 per yen, losing 0.2% during the week, reflecting a bearish market sentiment.
Stay tuned for more currency insights next week!
Commodity Corner
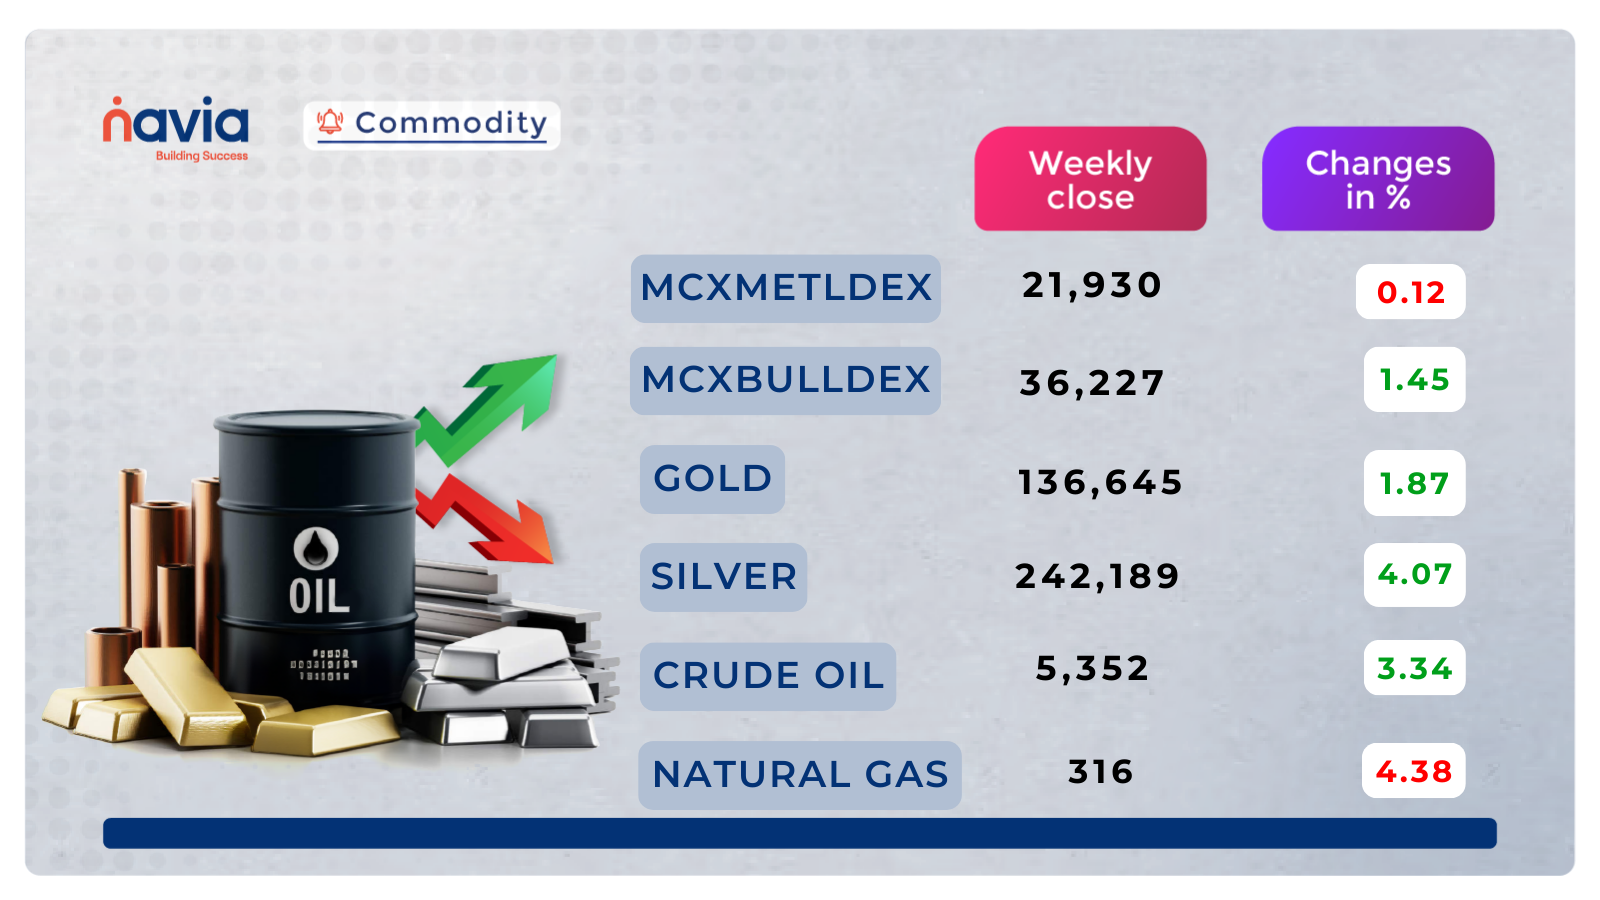
Crude Oil Futures continue to trade in a short-term corrective structure within a broader sideways-to-bearish range on the 1H timeframe. Price is currently moving below a declining trendline resistance, indicating price faced resistance during upward movements. The recent bounce from the lower support zone near 5010–5050 appears corrective and has did not sustain above the intermediate resistance area around 5180–5200. As long as price remains below 5300, the near-term bias stays weak, with higher levels may act as resistance. A sustained move below 5100 may indicate continuation of downward movement and could may move toward 5010 again. On the upside, only a decisive breakout above 5300 would negate the bearish structure and open scope for a move toward 5430. Until then, Crude Oil is may remain volatile with price fluctuations.
Gold Futures continue to trade within a broader rising channel, indicating that the higher-timeframe trend shows upward movement. However, recent price action shows a phase of consolidation and supply interaction near the upper resistance band around 140000–141000, where resistance observed. Price has pulled back sharply from this supply zone and is now stabilizing above the key structural support near 133500, which previously acted as a strong breakout base. The current movement appears to be a price consolidation phase within the broader uptrend rather than a trend reversal. As long as prices sustain above 133500, the bullish structure remains intact, and a gradual recovery toward 138500–140000 may be observed. A decisive breakout above 141000 would may lead to upward movement extension toward 143000–145000. On the downside, a breakdown below 133500 would weaken the bullish bias and may move toward lower levels toward 129000, where higher-timeframe demand is placed. Overall, trend shows upward tendency with near-term direction dependent on price behavior around the 133500–135000 support zone.
Natural Gas Futures remain under continued decline observed on the 1H timeframe and are trading within a well-defined descending channel, indicating a downward trend observed. Price has repeatedly faced resistance near lower highs and is currently hovering close to a key demand zone around 305–300, which has acted as interim support in recent sessions. The broader trend remains negative as long as prices stay below the declining trendline resistance near 330–335. Any bounce from the current zone is may remain limited corrective unless accompanied by strong follow-through buying. A decisive breakdown below 300 would may indicate continuation of downward movement and may move lower toward 280–255, where the next major demand zones are placed. On the upside, only a sustained move above 335 would weaken the bearish bias and allow a recovery toward 350–370. Overall, trend bias remains bearish, with upward movements may face resistance.
Do you have a question? Ask here and we’ll publish the information in the coming weeks.
Top Blogs of the Week!
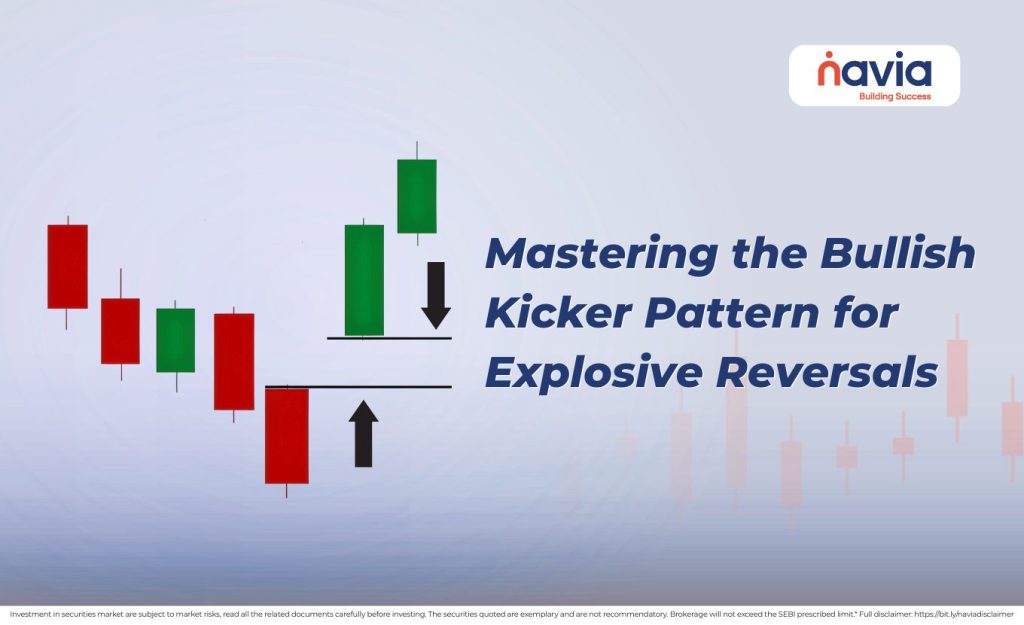
Sudden Impact: Mastering the Bullish Kicker Pattern for Explosive Reversals
The Bullish Kicker is a commonly observed, two-candle “knockout” signal that marks a sharp change from bearish despair to strong upward movement through a significant price gap.

The Dark Side of Discounts: How to Outsmart Online Shopping Scams in India
In 2026, the rise of AI-generated fake websites and sophisticated deepfake reviews has made identifying online shopping scams in India more challenging than ever.
N Coins Rewards

Refer your Friends & Family and GET 500 N Coins.
Do You Find This Interesting?

DISCLAIMER: Investment in securities market are subject to market risks, read all the related documents carefully before investing. The securities quoted are exemplary and are not recommendatory. Full disclaimer: https://bit.ly/naviadisclaimer.