Navia Weekly Roundup (August 04 – 08, 2025)
Week in the Review
The Indian stock market experienced its sixth consecutive weekly decline. The weakness was driven by persistent FII selling and concerns over potential US tariffs. The RBI’s monetary policy decision to maintain status quo did not provide market relief.
Indices Analysis
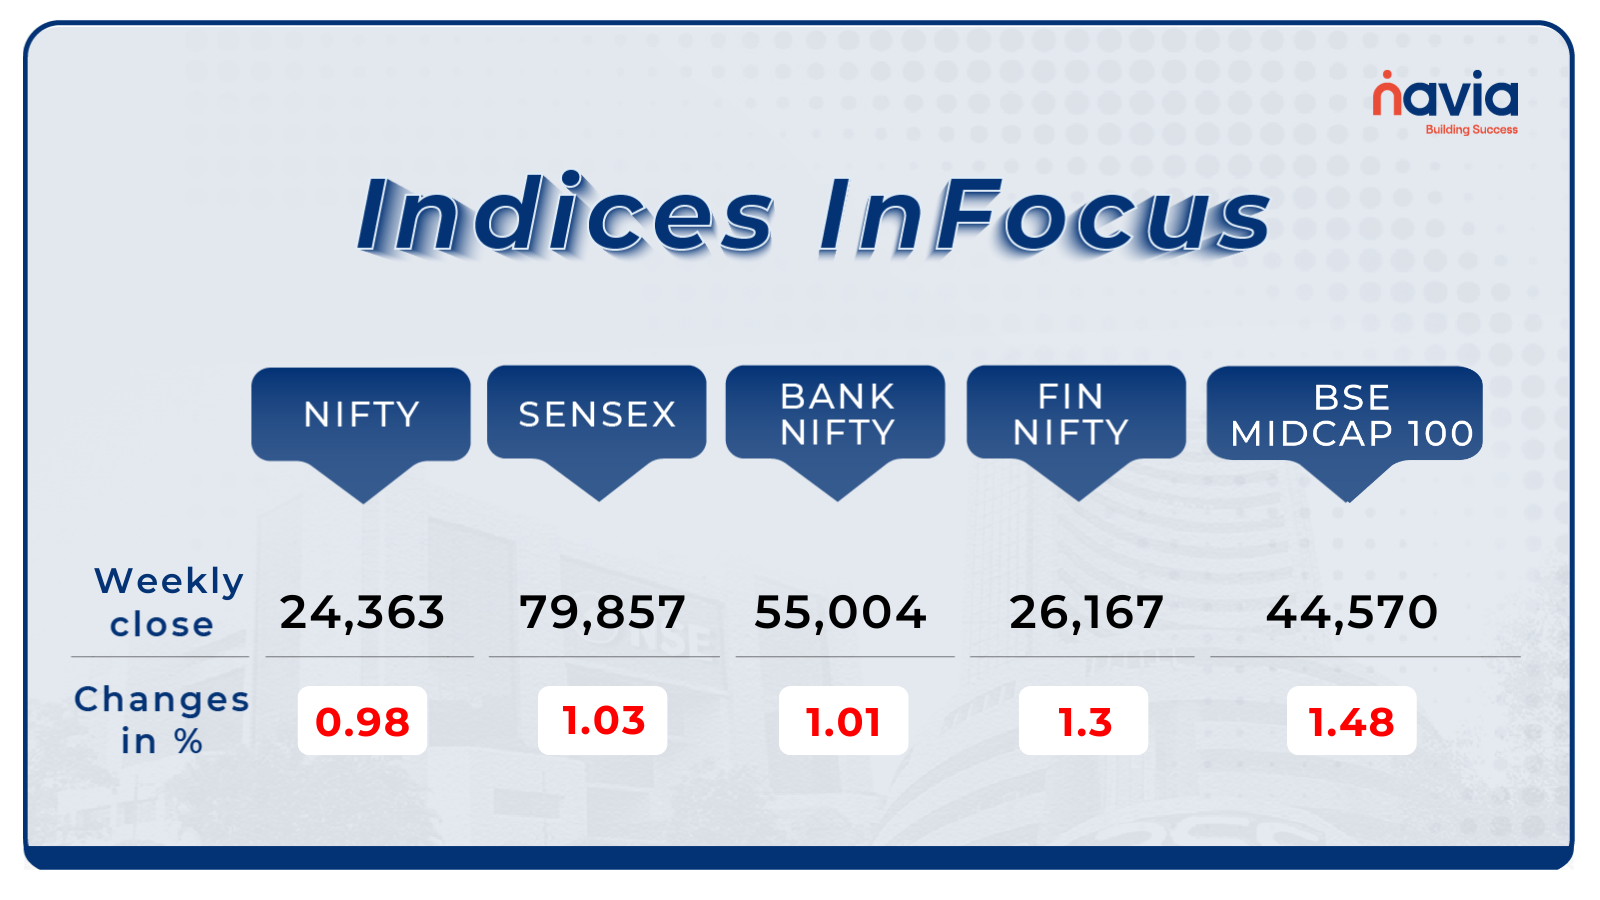
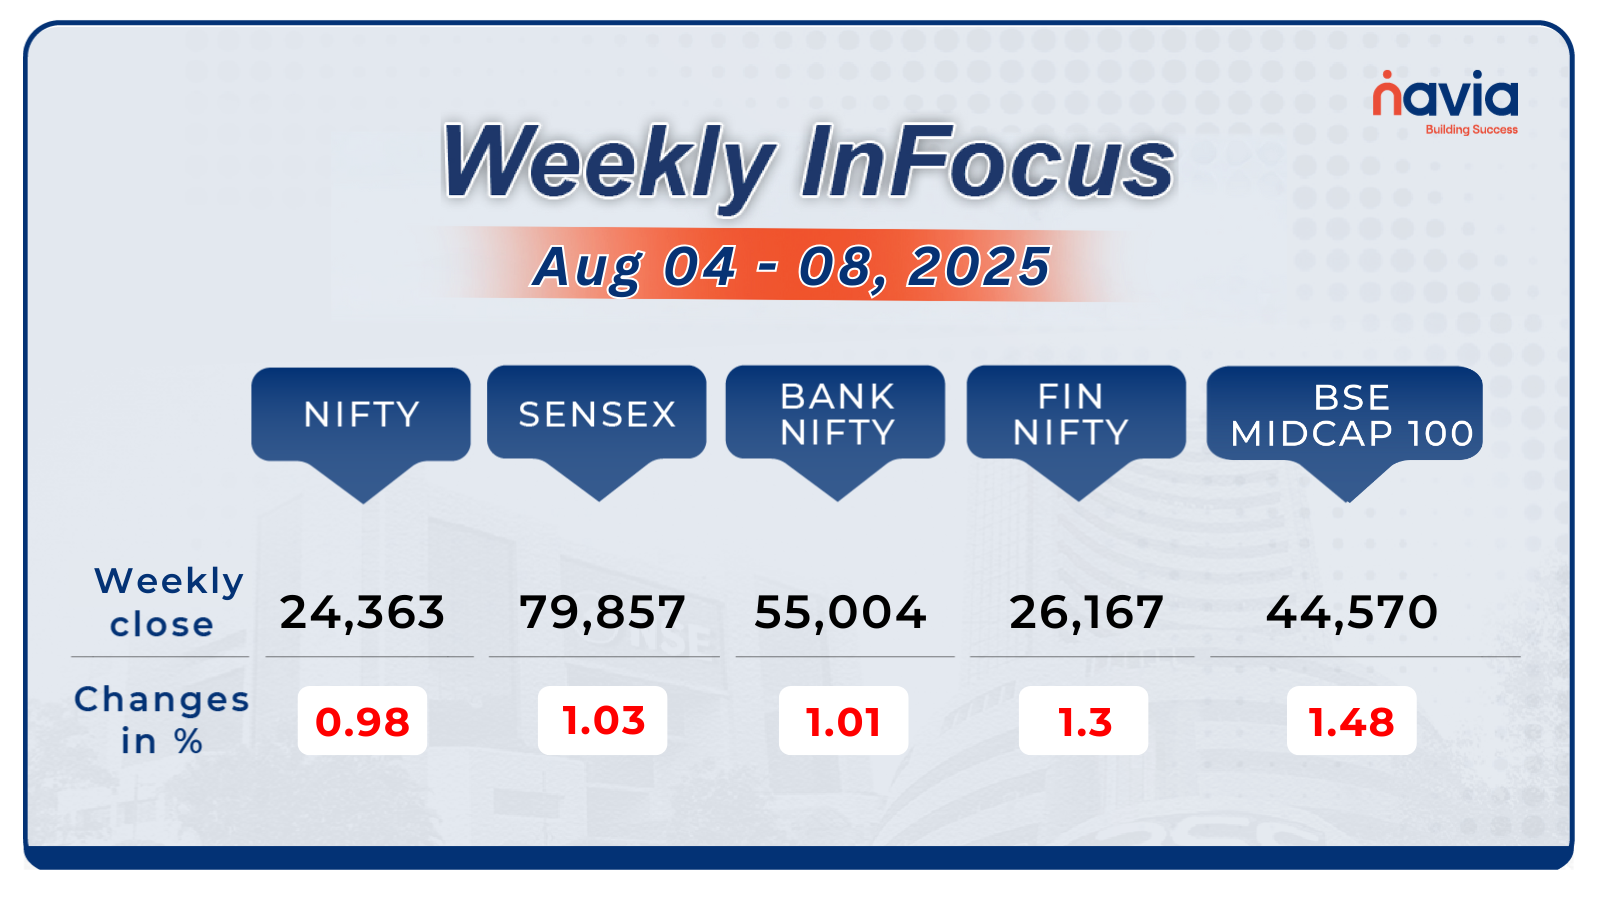
For the week, the BSE Sensex index declined 1.03 percent to end at 79,857, while Nifty50 fell 0.98 percent to close at 24,363.
During the week, the BSE LargeCap Index fell by 0.9%. This decline was driven by losses in key stocks such as SBI Cards & Payment Services, Indus Towers, Kotak Mahindra Bank, Waaree Energies, DLF, Adani Enterprises, Wipro, and Vedanta, which saw significant drops. However, Varun Beverages, Avenue Supermarts, Bosch, Jio Financial Services, Larsen & Toubro, and Hindustan Unilever managed to perform well, offering some positive movement in an otherwise weak market.
Meanwhile, the BSE SmallCap Index saw a sharper decline, shedding 1.86% for the week. Notable losers in this segment included Home First Finance Company India, Zen Technologies, Paras Defence and Space Technologies, Redington, Five-Star Business Finance, SML Isuzu, Kitex Garments, Faze Three, Blue Dart Express, Sportking India, Sindhu Trade Links, Indo Tech Transformers, Mangalore Refinery and Petrochemicals, and Himatsingka Seide, with their stock prices falling between 10% and 17%. On the other hand, some stocks showed strong growth, including Jayaswal Neco Industries, Saurashtra Cement, Vimta Labs, Advait Energy, CarTrade Tech, Bliss GVS Pharma, and Sudarshan Chemical Industries, with gains ranging from 15% to 24%.
Interactive Zone!
Test your knowledge with our Markets Quiz! React to the options and see how your answer stacks up against others. Ready to take a guess?
Sector Spotlight
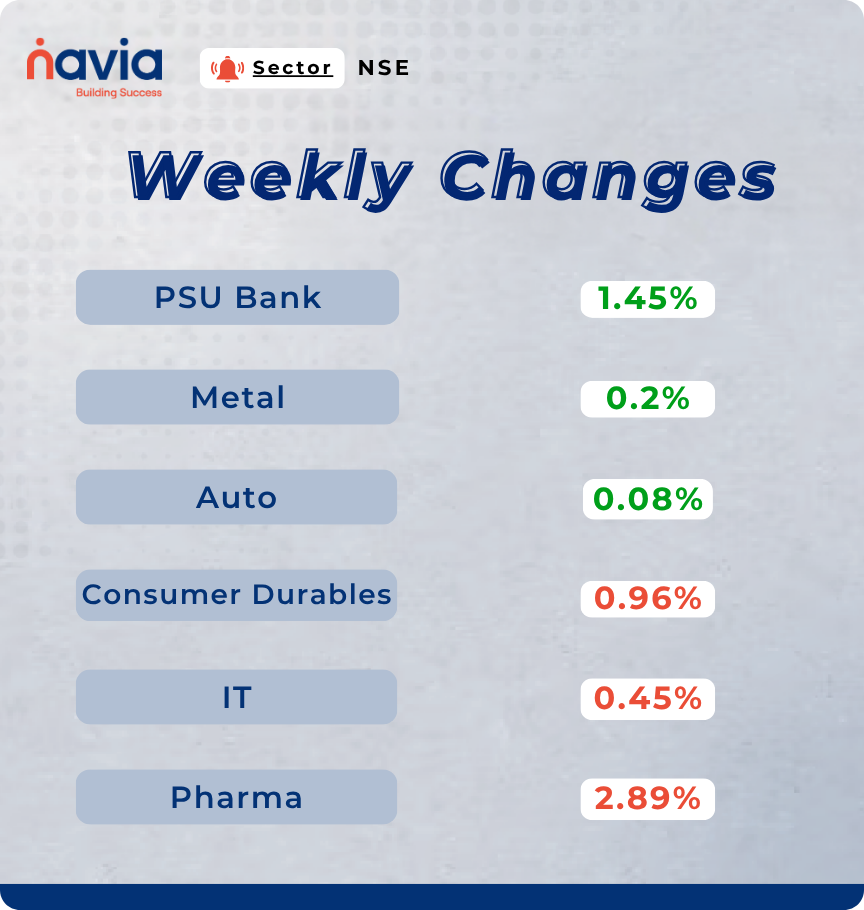
On the sectoral, Nifty PSU Bank rose 1.4 percent, Nifty Metal added 0.2 percent, Nifty Auto added a slight 0.08 percent, Nifty Consumer Durables fell 0.9 percent, Nifty IT declined 0.4 percent, and Nifty Pharma shed 2.8 percent.
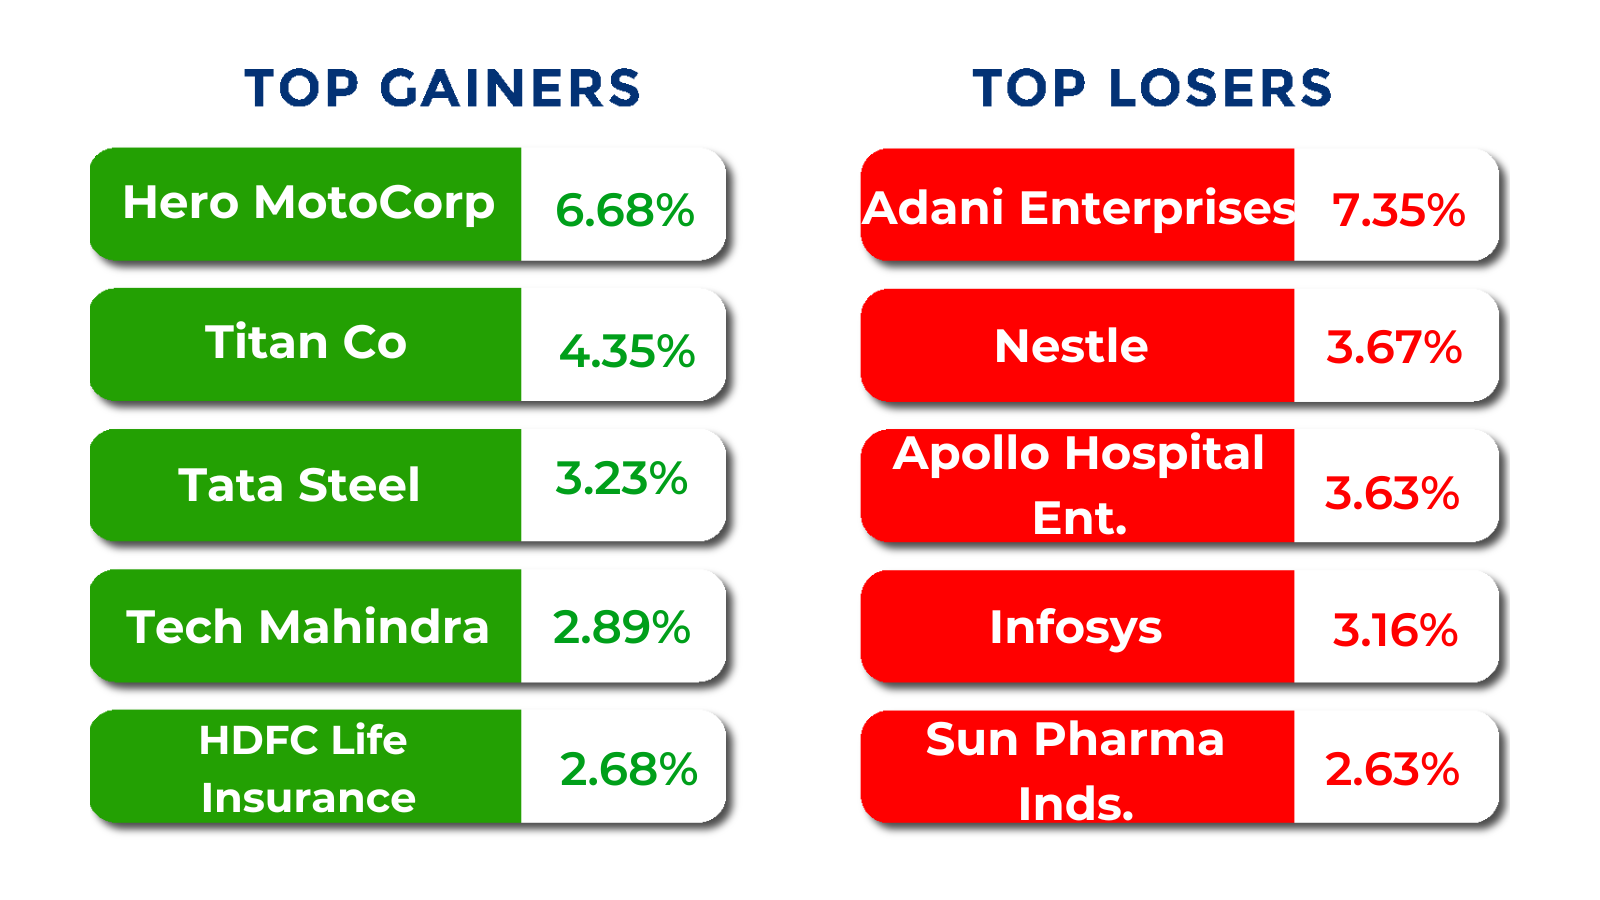
Top Gainers and Losers
Currency Chronicles
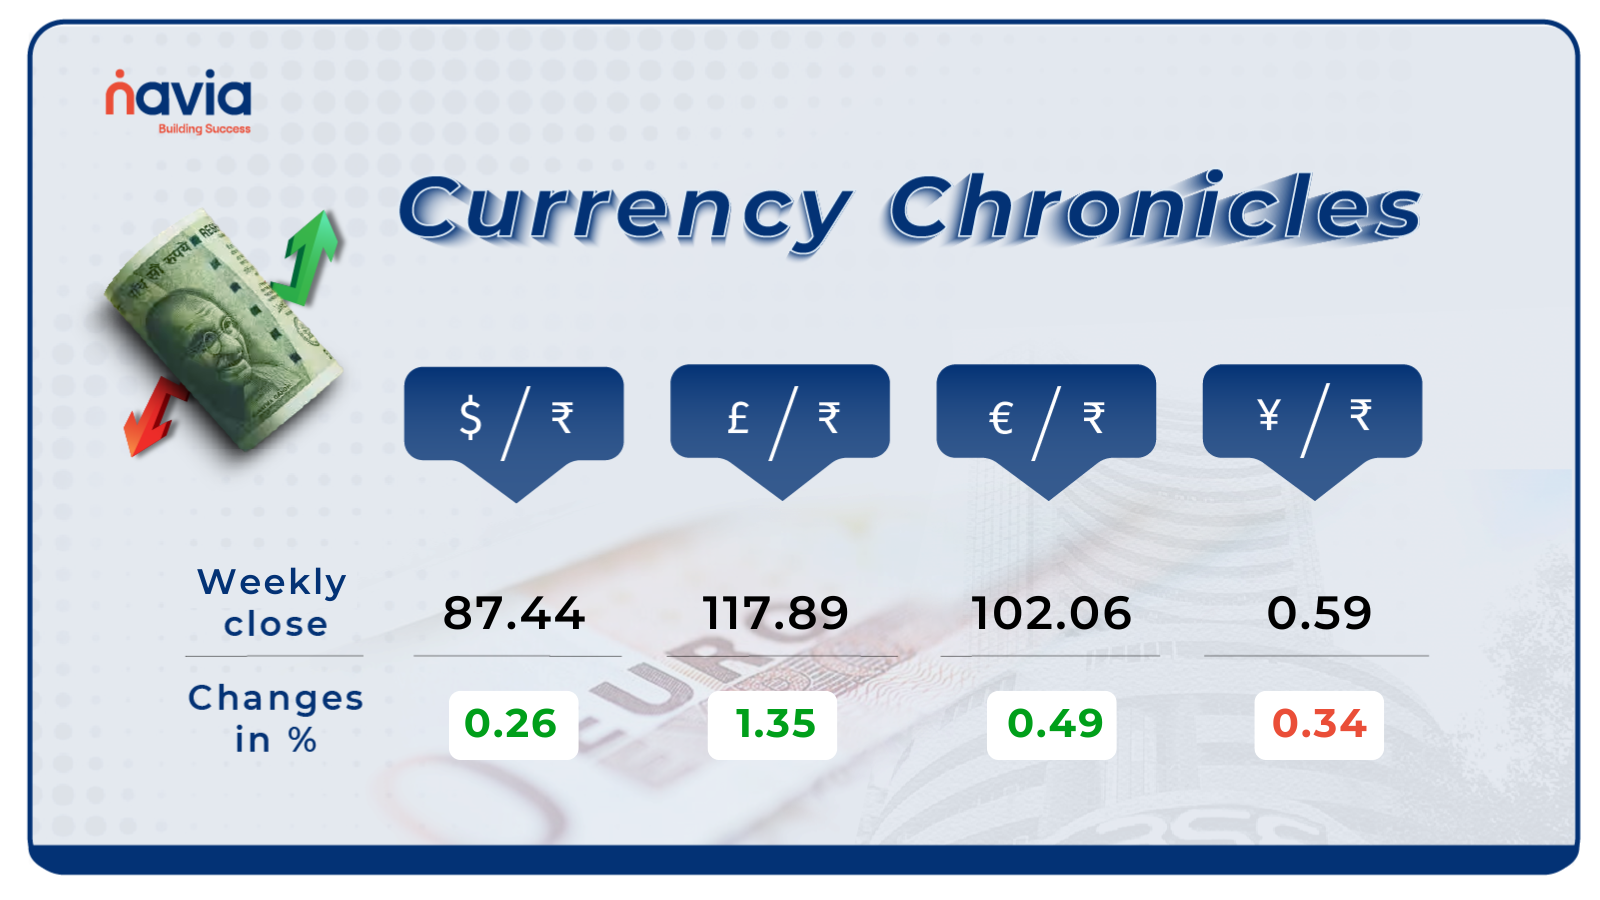
USD/INR:
The USD/INR rate closed at ₹87.44 per dollar, gaining 0.26% during the week, reflecting a neutral market sentiment.
EUR/INR:
The EUR/INR rate closed at ₹102.06 per euro, gaining 0.49% during the week, reflecting a bullish market sentiment.
JPY/INR:
The JPY/INR rate closed at ₹0.59 per yen, declining by 0.34% during the week, reflecting a neutral market sentiment.
Stay tuned for more currency insights next week!
Commodity Corner
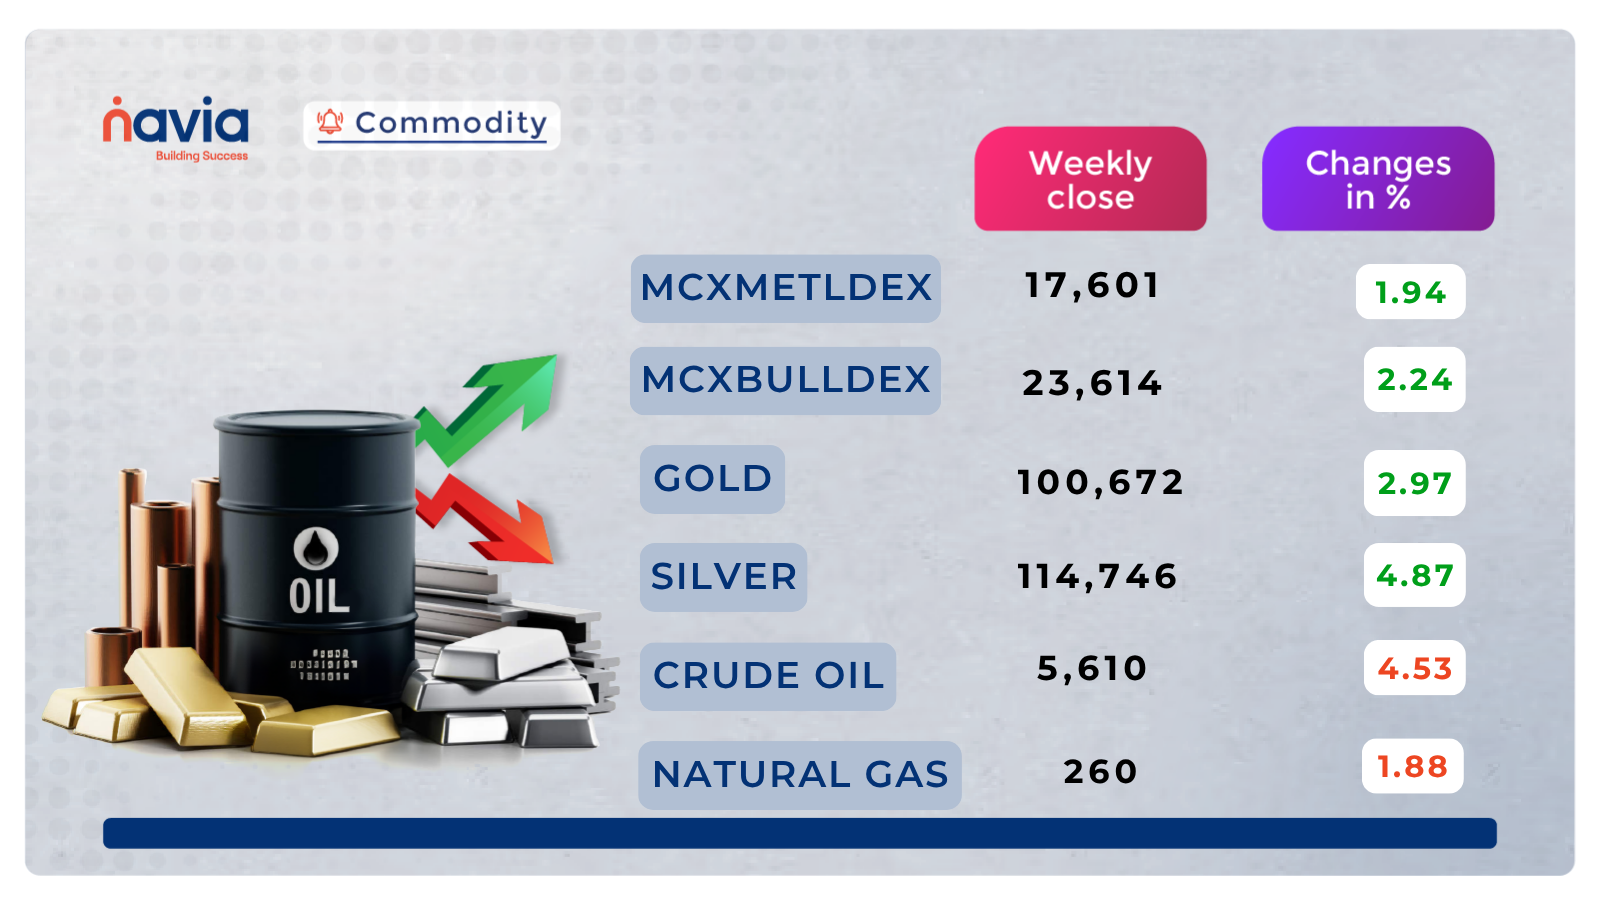
Crude oil closed at 5,610, having broken below the rising wedge pattern formed since early July. This breakdown from the wedge pattern suggests weakening bullish momentum and the potential for a short-term trend reversal or deeper pullback.The price has also decisively breached a key horizontal support at 5,641, now turning that zone into resistance. The broader structure indicates that crude is entering a short-term bearish phase, especially after multiple rejections from higher levels near 6,172 and 5,914.The next strong support lies at 5,512, a level that aligns with the lower boundary of the June accumulation zone.
Gold closed at 100,672, having recently tested the key resistance zone near 101,500–101,600 marked by an ascending trendline from previous swing highs. The price remains elevated after a strong rally from the 97,500 zone and is now attempting to hold above previous breakout levels.Ascending trendline from July low supports bullish structure.Price consolidating near breakout zone; watching volume for confirmation.RSI & momentum indicators suggest slight overbought condition, so entry near pullback is ideal. Gold is consolidating near 101,350–101,450; holding above this zone may indicate strength, while a break below 100,475 could signal weakness.
Natural Gas closed at 260. The recent price action on the 4-hour chart indicates a phase of tight consolidation following a significant decline from the June highs of over 326. The market is presently testing a previously established accumulation range and remains restricted below a near-term resistance at 279.1. From a technical perspective, the immediate support lies at 266.7, while a stronger support zone is seen near 246.5. On the upside, resistance levels are observed at 279.1, followed by intermediate and strong resistance zones at 315.4 and 326.1, respectively. Additionally, a long-term descending trendline from June highs continues to exert downward pressure, suggesting potential selling interest on any upward move.
Do you have a question? Ask here and we’ll publish the information in the coming weeks.
Top Blogs of the Week!
Leading Vs Lagging Indicators Explained: What’s the Difference?
Leading vs Lagging Indicators: The Trader’s Timing Toolkit! Timing is everything in trading — but should you predict or confirm? Learn the difference between leading and lagging indicators, when to use each, and how combining them can sharpen your entries and exits for smarter, more confident trades.

Common Mistakes to Avoid While Using Margin Trading Facility (MTF)
MTF Mistakes That Could Cost You Big — And How to Avoid Them! Margin Trading Facility can supercharge your returns — or your losses. Learn the 10 most common mistakes traders make with MTF, from overleveraging to ignoring stop-losses, and get practical tips to trade smarter, manage risks, and protect your capital.
N Coins Rewards

Refer your Friends & Family and GET 500 N Coins.
Do You Find This Interesting?

DISCLAIMER: Investments in securities market are subject to market risks, read all the related documents carefully before investing. The securities quoted are exemplary and are not recommendatory. Full disclaimer: https://bit.ly/naviadisclaimer.