Navia Weekly Roundup (Apr 06 – Apr 10, 2026)
- Week in the Review
- Indices Analysis
- Interactive Zone!
- Sector Spotlight
- Top Gainers and Losers
- Currency Chronicles
- Commodity Corner
- Top Blogs of the Week!
- N Coins Rewards
Week in the Review
Indian equity markets snapped a six-week losing streak, posting their best weekly gains since February 2021, supported by improving global cues, a strengthening rupee, a slowdown in FII selling, and easing geopolitical tensions following signs of de-escalation in the US–Iran conflict.
Indices Analysis
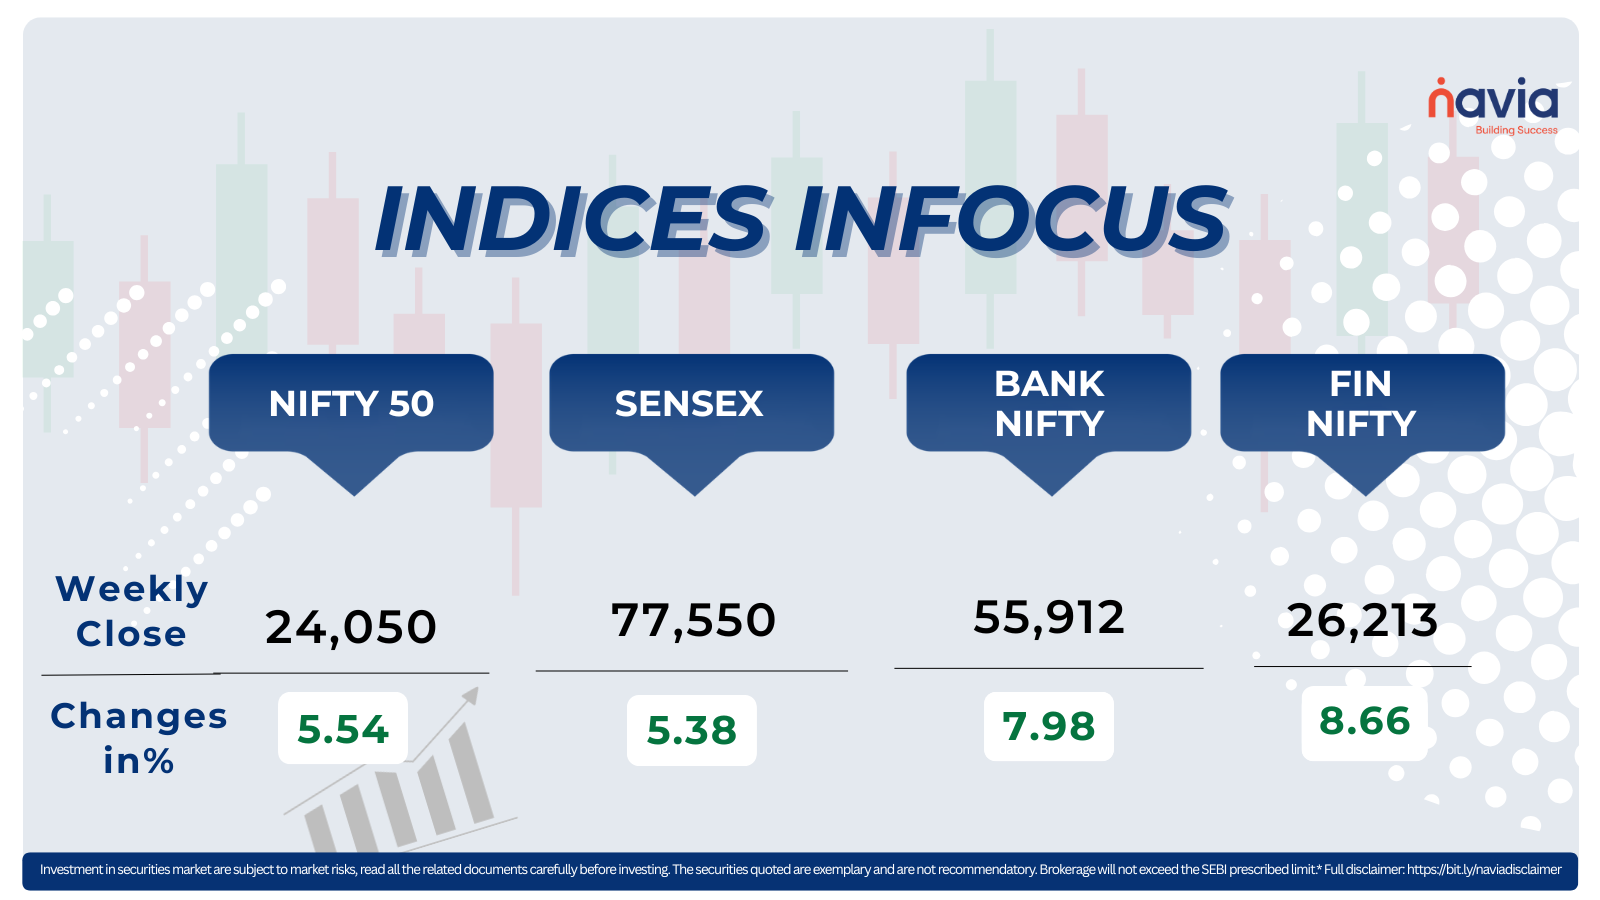
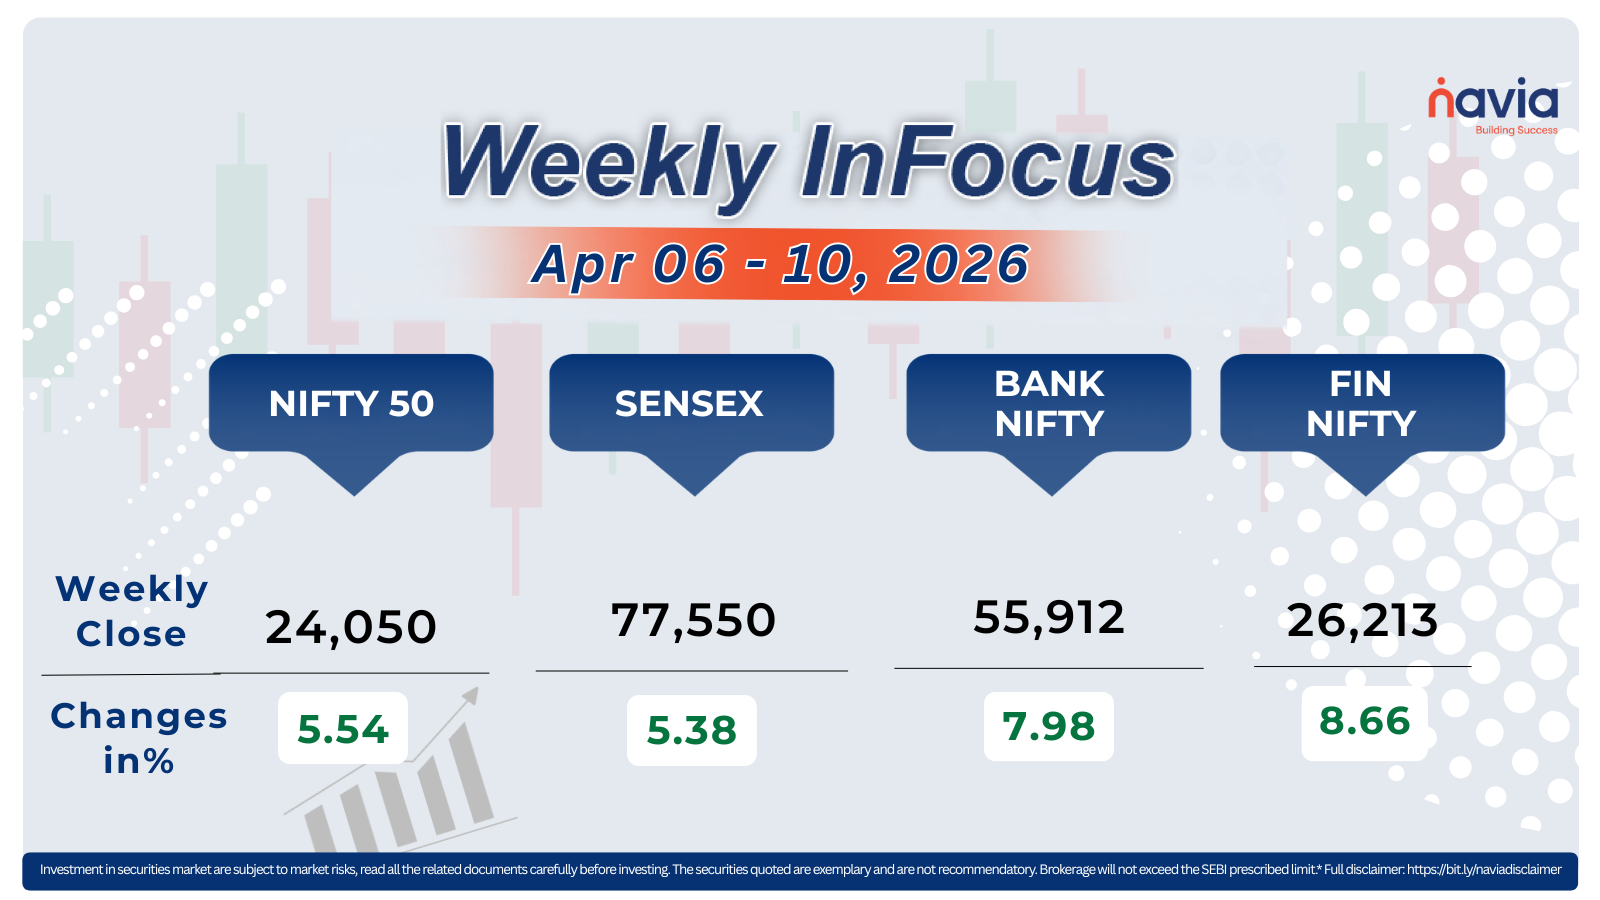
For the week, the BSE Sensex jumped 5.38% to end at 77,550.25, while the Nifty 50 climbed 5.54% to settle at 24,050.60, marking their best weekly performance since February 2021.
Nifty Midcap 100 Index advanced nearly 8%, supported by gains in Ashok Leyland, ICICI Prudential Asset Management Company, Billionbrains Garage Ventures, L&T Finance, Phoenix Mills, and BSE Limited, which rose between 15% and 19%.
The Nifty Smallcap Index gained 7.6% during the week, led by stocks such as Ola Electric Mobility, Cohance Lifesciences, Neuland Laboratories, Aditya Birla Real Estate, Five-Star Business Finance, Angel One, Pine Labs, and Amber Enterprises India, which surged between 15% and 44%.
During the week, HDFC Bank recorded the highest addition in market capitalisation, followed by ICICI Bank, Bajaj Finance, and Larsen & Toubro. On the other hand, Sun Pharmaceutical Industries, Infosys, and Reliance Industries saw erosion in their market capitalisation.
Foreign Institutional Investors (FIIs) remained net sellers in Indian equities for the seventh consecutive week, albeit at a moderated pace, offloading shares worth ₹20,710.35 crore. Meanwhile, Domestic Institutional Investors (DIIs) extended their buying streak, purchasing equities worth ₹21,602.32 crore.
Interactive Zone!
Test your knowledge with our Markets Quiz! React to the options and see how your answer stacks up against others. Ready to take a guess?
Sector Spotlight
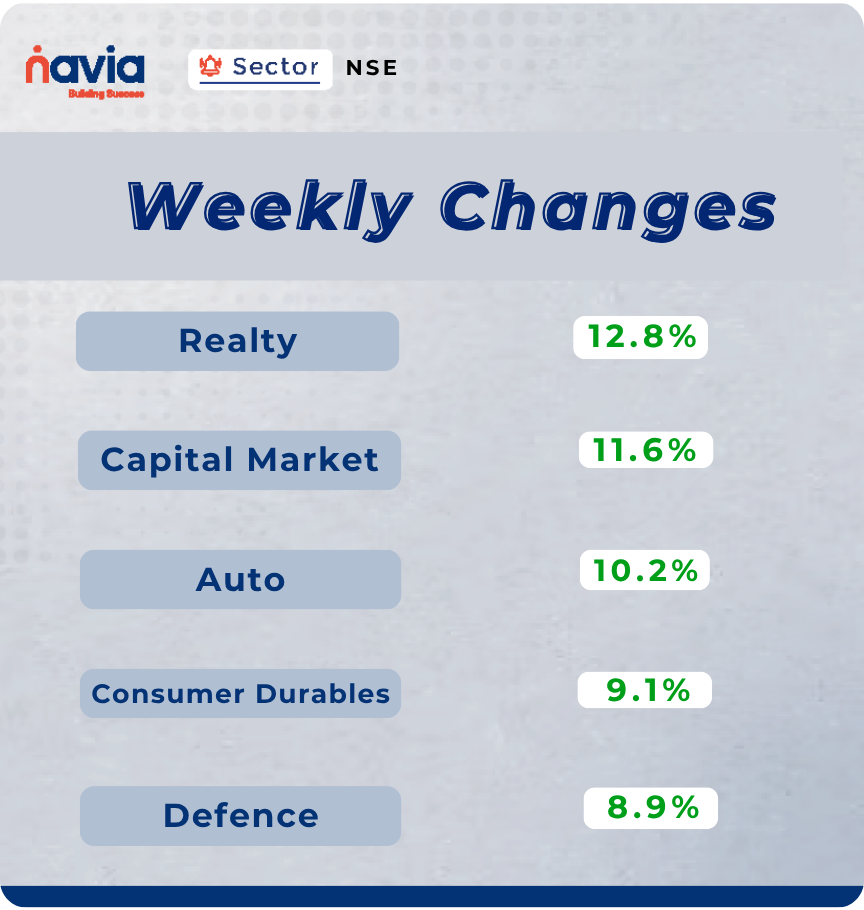
All sectoral indices ended the week in the green. The Nifty Realty Index led the gains, rising 12.8%, followed by the Nifty Capital Market Index which advanced 11.6%. The Nifty Auto Index surged 10.2%, while the Nifty Consumer Durables Index jumped over 9%. The Nifty India Defence Index also posted strong gains, rising 8.9%.
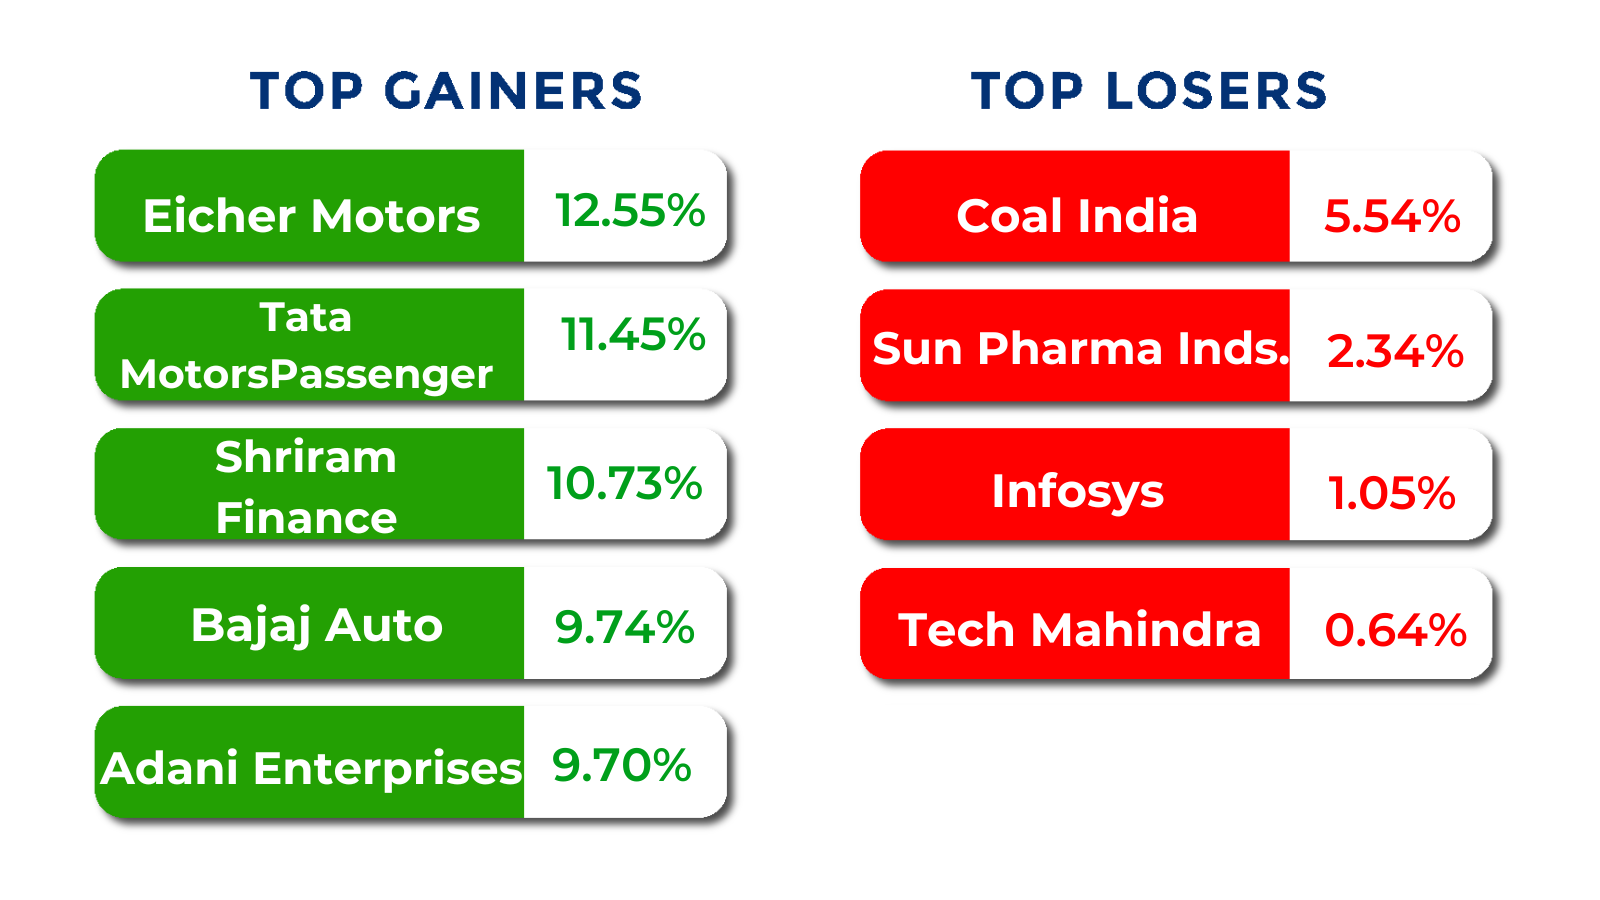
Top Gainers and Losers
Currency Chronicles
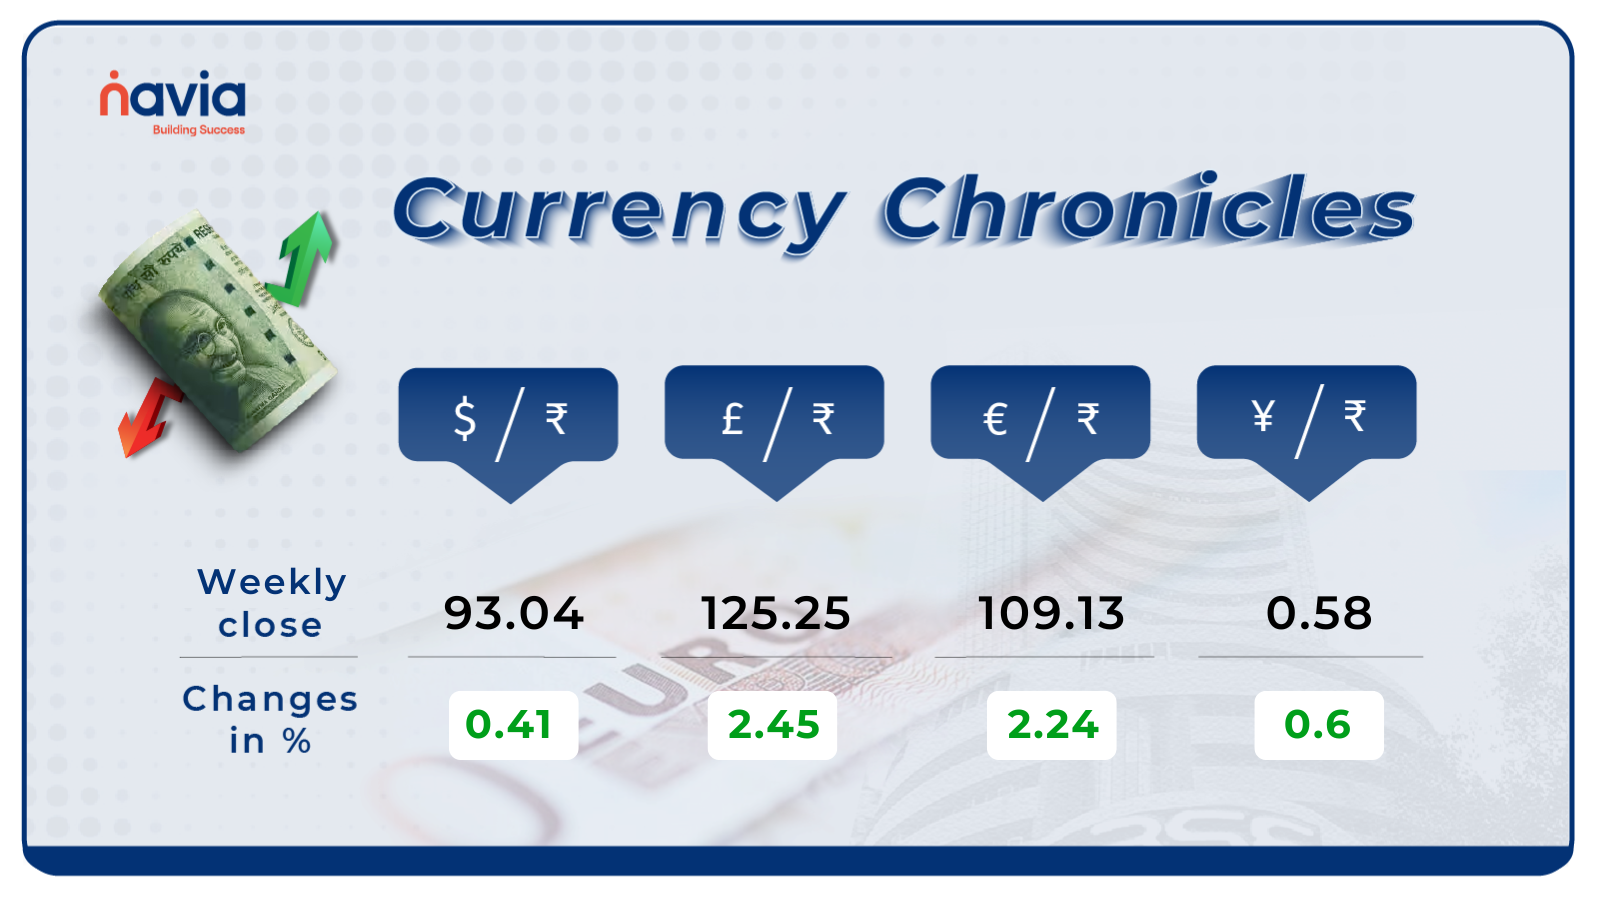
USD/INR:
The USD/INR rate closed at ₹93.04 per dollar, gaining 0.41% during the week, reflecting a bullish market sentiment.
EUR/INR:
The EUR/INR rate closed at ₹109.13 per euro, gaining 2.24% during the week, reflecting a bullish market sentiment.
JPY/INR:
The JPY/INR rate closed at ₹0.58 per yen, gaining 0.6% during the week, reflecting a bullish market sentiment.
Stay tuned for more currency insights next week!
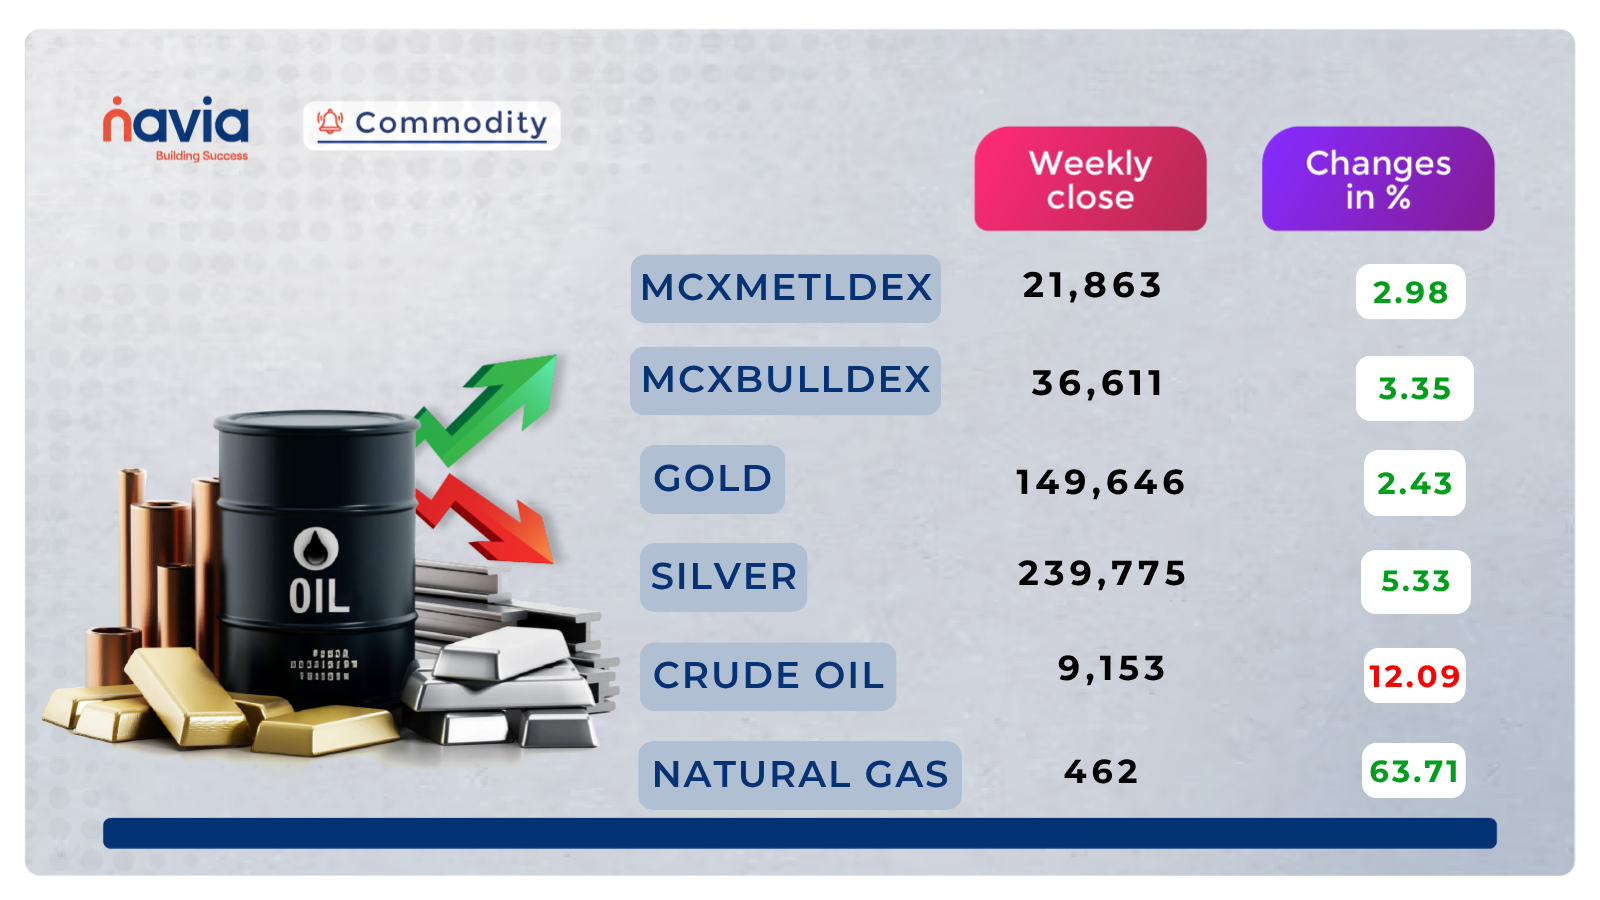
Commodity Corner
Crude Oil futures are showing sharp corrective pullback with a prominent red candle after failing to sustain above the recent highs near 9840. The price has respected the long-term ascending trendline connecting higher lows from the strong demand base near 7230–8415 but broke below short-term consolidation levels, preserving the overall bullish structure on higher timeframe despite today’s rejection and increased volatility.
The broader structure remains bullish on the higher timeframe, trading within the ascending channel after the decisive breakout above 8785–8975. The current zone around 8960–8415 displays strong selling pressure and higher volatility after the sharp move, reflecting short-term exhaustion or profit booking near the upper part of the recent rally. A sustained close above 9380 could confirm renewed bullish momentum and target 9840 or higher extension levels within the channel.
On the downside, immediate support lies near 8415–8708, followed by stronger structural support at lower levels. A breakdown below 8415 may invite deeper corrective pressure toward 8708 levels, though the dominant uptrend strongly favors buyers on dips unless sustained rejection persists.
Gold futures are showing mild recovery with a small green candle after recent red candles and consolidation. Price continues to respect the ascending trendline connecting higher lows from the strong demand base near 138900, preserving the short-term bullish structure with renewed buyer aggression despite the minor intraday dip.
The broader structure remains bullish on the higher timeframe, trading within the ascending channel after the decisive breakout above 146000–148000. The current zone around 152000–153000 displays acceptance with reduced selling pressure and building strength after the pullback, reflecting buyer control near the upper part of the recent move. A decisive breakout and sustained close above 153500 could confirm renewed bullish momentum and target 155000 or higher extension levels within the channel.
On the downside, immediate support lies near 150000–149000, followed by stronger structural support at 146000. A breakdown below 150000 may invite short-term corrective pressure toward 149000–146000 levels, though the dominant uptrend strongly favors buyers on dips unless a clear break occurs.
Natural Gas futures are showing mild bearish pressure with a small red candle after failing to sustain above 254. The price has formed a lower high and is testing the ascending trendline support, confirming short-term seller aggression following the rejection from the 280 supply zone.
The recent sessions have shifted the short-term bias to cautious-to-bearish, validating the pullback and consolidation after the rally toward 305. The sustained weakness below 275 has been accompanied by red candle dominance and reduced buyer follow-through. A sustained close below 254 could accelerate downside momentum toward 247 or lower extension levels.
On the upside, immediate resistance now lies near 259, followed by stronger supply at 271–280. A breakout above 259 would be required to invalidate the current bearish shift and invite a corrective bounce, though momentum strongly favours sellers on any rally at present.
Silver Futures are showing strong recovery with a prominent green candle after holding above the recent lows near 243000. Price continues to respect the overhead descending trendline connecting lower highs from the peak near 267810, maintaining a short-term bearish bias with consistent seller dominance despite the strong bounce and green candle testing the lower channel boundary.
The broader structure remains bearish-biased on the higher timeframe, trading below the descending trendline after the sustained breakdown from higher levels. The current zone around 246000–249000 displays strong buying pressure and higher volatility after the sharp move, reflecting short-term relief buying near the lower part of the recent decline. A decisive breakout and sustained close above 249000 could signal short-term relief and trigger fresh upside momentum toward 252500 or higher, though momentum strongly favours sellers unless clear reversal occurs.
On the downside, immediate support lies at 238500–232000, followed by stronger structural demand if breakdown occurs. A clear break below 238500 would confirm renewed bearish momentum and invite deeper corrective pressure toward lower extensions aligned with the downward trendline.
Do you have a question? Ask here and we’ll publish the information in the coming weeks.
Top Blogs of the Week!

India’s LPG Market in 2026: Supply Trends and Energy Sector Developments
As of April 2026, India is navigating its most significant energy challenge in recent history. What began in early March as a “slight concern” has evolved into a strategic crisis due to the blockade of the Strait of Hormuz amid the ongoing West Asia conflict.

Contango vs Normal Backwardation: What’s the Difference in Commodity Markets?
In today’s global commodity markets, particularly with the April 2026 supply tensions in the Strait of Hormuz affecting crude oil and maritime lanes, understanding how future prices relate to current prices is essential.
N Coins Rewards

Refer your Friends & Family and GET 500 N Coins.
Do You Find This Interesting?

DISCLAIMER: Investment in securities market are subject to market risks, read all the related documents carefully before investing. The securities quoted are exemplary and are not recommendatory. Full disclaimer: https://bit.ly/naviadisclaimer.