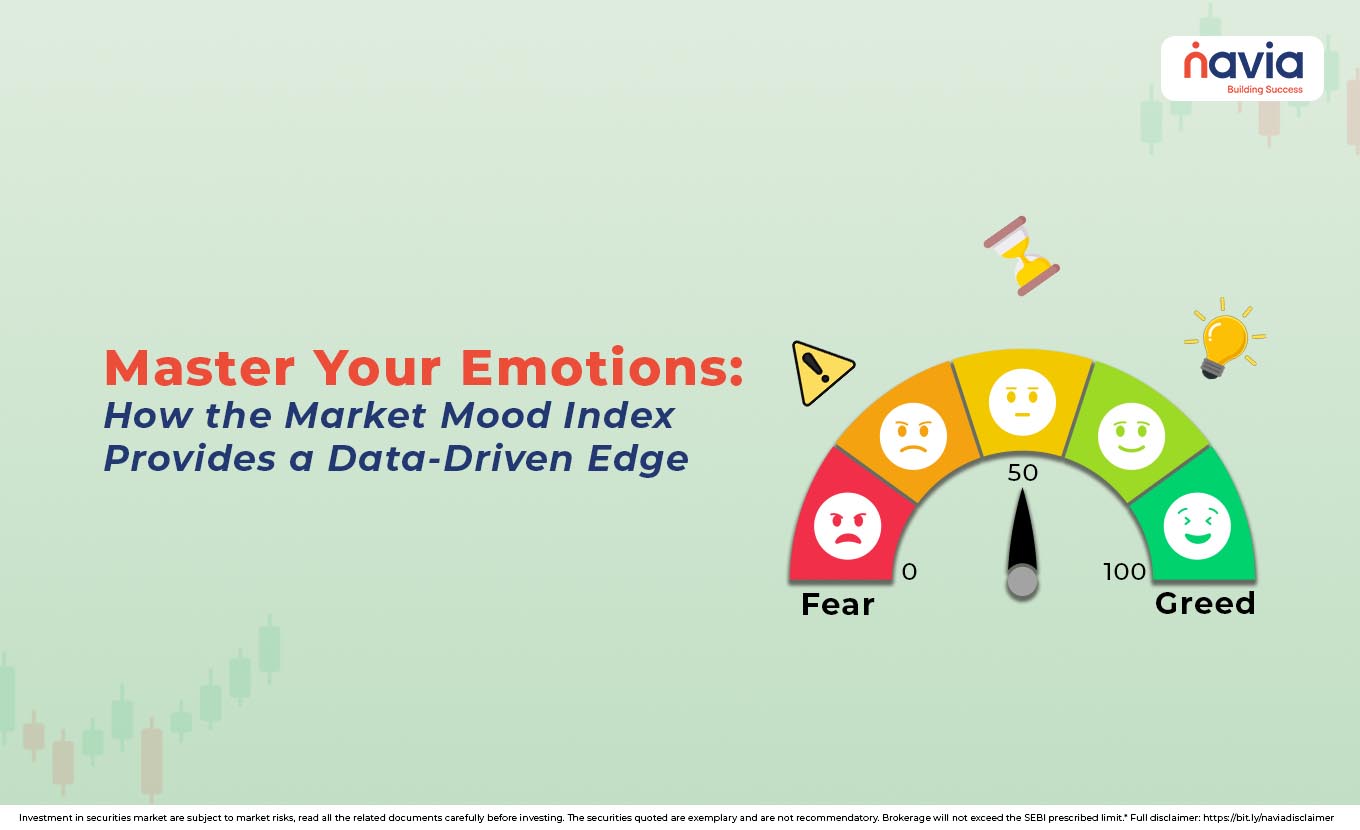
Master Your Emotions: How the Market Mood Index Provides a Data-Driven Edge
- What is the Market Mood Index (MMI)?
- How is the Market Mood Index Built?
- How to Effectively Use the Market Mood Index Chart?
- Conclusion
- Frequently Asked Questions
In the stock market, emotions are considered the greatest enemies of profit. When fear grips the market, investors panic-sell, missing out on cheap valuations. When greed takes over, investors recklessly buy at inflated prices, only to face losses during the inevitable correction.
For disciplined Indian investors, there is a tool that available to combat this psychological gap is Market Mood Index (MMI). It’s a highly valuable sentiment indicator that will translate the complex behavior of traders and investors into an easy-to-read score.
Understanding market mood index today will tell you how the score is calculated, and what action to take in each zone which is vital for any trader looking to succeed in the dynamic Indian equity markets. This blog will help you understand the concept in a simple way.
What is the Market Mood Index (MMI)?
The Market Mood Index is a sentiment-tracking tool that prevailing emotional state of the Indian stock market-specifically focusing on the Nifty 50 and Sensex. The index operates on the principle of contrarian investing means smart investors will buy when others are fearful and sell when others are greedy. This market mood indicator will provide you with the objective data to adopt this contrarian stance.
The MMI uses a scale from 0 to 100, that are categorized into four emotional zones, let’s see what they are;
| MMI Score Range | MMI Zone | Market Sentiment | Contrarian Action |
|---|---|---|---|
| Below 30 | Extreme Fear | Markets are oversold due to panic. | Time to Buy (Open fresh positions). |
| 30 to 50 | Fear | Investors are nervous and cautious. | Accumulate (Cautious buying). |
| 50 to 70 | Greed | Investors are overly optimistic and buy aggressively. | Trim (Avoid fresh buying/Book for partial profits). |
| Above 70 | Extreme Greed | Markets are overbought; euphoria prevails. | Sell (Avoid fresh positions/Book for major profits). |
Tracking the marketmoodindex helps you to see the market’s psychological state that will guide your long-term investment decisions.
How is the Market Mood Index Built?
Unlike VIX, that only measures volatility, MMI combines six equally weighted factors to give a complete view of market psychology. The strength of the market mood indicator will completely lie in its comprehensiveness. The six components often used to calculate the MMI are given below.
| Components | Definition |
|---|---|
| FII Activity (Foreign Institutional Investor Activity) | What it measures: The net open interest of FIIs in Index Futures on the NSE. |
| Volatility and Skew | What it measures: Volatility is gauged by the India VIX (India’s fear gauge) and Skew measures the difference in implied volatility between out-of-the-money (OTM) Put options and OTM Call options. |
| Market Momentum | What it measures: The difference between the 90-day and 30-day Exponential Moving Averages (EMAs) of the Nifty 50. |
| Market Breadth | What it measures: Calculated using the Modified Arms Index, which compares the ratio of advancing stocks to declining stocks, factoring in their respective volumes. |
| Price Strength | What it measures: The net percentage difference between stocks trading near their 52-week highs versus those near their 52-week lows. |
| Demand for Gold | What it measures: The relative price return of Gold compared to the Nifty 50 over a recent period (e.g., the last two weeks). |
Each of these components of MMI is assigned an equal weight and normalized to calculate the daily market mood index today.

How to Effectively Use the Market Mood Index Chart?
The market mood index chart is a powerful visual tool that maps the MMI score against the underlying index (Nifty or Sensex) over time. It clearly illustrates how price tops often align with extreme greed, and price bottoms often align with extreme fear.
Contrarian Investing
The MMI’s best use in signaling opportunities to go against the herd;
🔹 Buy Now: When the MMI enters the Extreme Fear Zone (<30), suggests that the selling pressure is irrational and the market is oversold. It is a good time to increase your exposure to high-quality stocks.
🔹 Sell High: When he MMI is in the Extreme Greed Zone (>70), the market is frothy and overvalued. And it is a good time to book profits and raise cash.
Risk Management
Use the MMI to adjust the size of your positions:
🔹 If the market mood indicator is in extreme greed, reduce the size of your new trades and maintain strict stop-losses.
🔹 If the MMI is in Extreme Fear, you can consider larger position sizing, as the risk-to-reward ratio is often favorable.
Validation Not Prediction
We can say that MMI is a sentiment tool, not a perfect timing tool. That helps to validate the emotional context of a price move:
For example;
🔹 If the Nifty is rising, but the MMI is only in the Neutral (50) zone; the rally has room to run.
🔹 If the Nifty is rising, and the MMI is in Extreme Greed (85), you know that the rally is being fueled by euphoria and is on borrowed time.
Conclusion
The market mood index is a data-driven defense against the biggest enemy in trading: human emotion. It will measure the collective state of mind that gives you the clarity needed to act rationally when others are acting impulsively.
So, the regular check of the market mood index today and understanding the logic will make you achieve in the vital contrarian edge. Also, remember the mantra: when the MMI is signaling fear, be brave; when it is signaling greed, be cautious.
Do You Find This Interesting?
We’d Love to Hear from you-

Frequently Asked Questions
Is market mood a contrarian indicator?
Yes, the Market Mood Index (MMI) is primarily used as a contrarian indicator. Its core principle is based on the idea that investors should go against the crowd. When the MMI registers Extreme Greed (high scores), it suggests the market is peaking and investors should be fearful (selling). Conversely, when the MMI registers Extreme Fear (low scores), it suggests the market is oversold due to panic, and investors should be greedy (buying).
What is the market mood index?
The Market Mood Index (MMI) is a composite sentiment indicator designed for the Indian stock market. It tracks the collective emotional state of investors, translating multiple underlying factors (such as volatility, momentum, and demand for safe assets) into a single score, typically ranging from 0 (Extreme Fear) to 100 (Extreme Greed).
How reliable is the market mood index?
The MMI is considered a moderately reliable indicator for identifying extremes, but it is not a perfect predictor of timing.
How do professionals use market mood?
Professional traders and analysts use the market mood for risk management and position sizing:
➣ Validating Entry/Exit: They use it to confirm the emotional context of technical price action. If a stock hits resistance during a period of Extreme Greed, the sell signal is stronger.
➣ Adjusting Exposure: They aggressively reduce portfolio risk (sell/trim positions) when the index is in the Greed Zone and look to deploy cash (buy/increase exposure) when it is in the Fear Zone.
➣ Contrarian Confirmation: They ensure they are not making emotional decisions by confirming their actions align with a contrarian stance dictated by the index.
Is trading 90% psychology?
Yes, the widely accepted view among professional traders is that trading is predominantly psychological. While specific percentages vary, the consensus is that psychology and discipline (including risk control) account for 70% to 90% of trading success, while strategy and analysis make up the remainder.
DISCLAIMER: Investment in securities market are subject to market risks, read all the related documents carefully before investing. The securities quoted are exemplary and are not recommendatory. Full disclaimer: https://bit.ly/naviadisclaimer.