The Tug-of-War: Mastering the Long-Legged Doji for Market Turning Points
- What is a Long-Legged Doji?
- The Long Legged Doji Meaning: A Story of Extreme Indecision
- How Market Participants Interpret the Long-Legged Doji Pattern?
- Long-Legged Doji vs. Other Dojis
- Common Pitfalls to Avoid
- Conclusion: The Quiet Before the Storm
- Frequently Asked Questions
In the chaotic world of stock market charts, where green and red candles battle for dominance, there is one symbol that represents the ultimate stalemate: the Long-Legged Doji. For a seasoned trader, the long legged doji candlestick pattern is a loud, commonly interpreted as an indication of market indecision, a moment where the bulls and bears have fought to a draw.
Understanding the long legged doji meaning is essential for any trader who wants to observe situations where prevailing momentum appears to be weakening. In your trading journey, this single candle is often studied to understand potential changes in market sentiment.
What is a Long-Legged Doji?
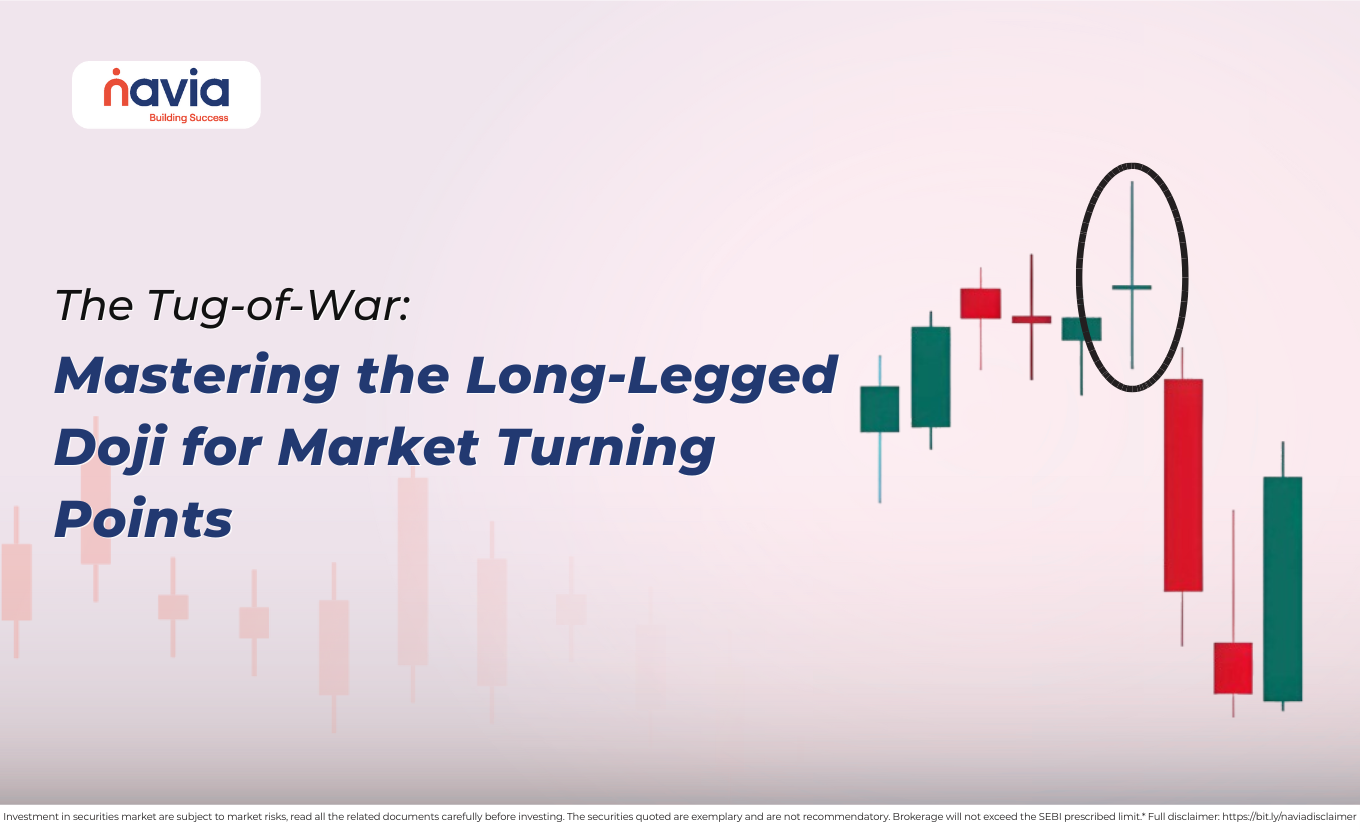
The long-legged doji is a type of Doji candlestick characterized by long upper and lower shadows and closing price that is identical to the opening price. Unlike Doji, the long legged doji candlestick features dramatic price swings in both directions during the trading session. Means, at some point, the buyers pushed the price significantly higher and at another point the sellers crashed the price significantly lower.
By the time the closing bell rang, the price returned exactly to where it started, let’s see the anatomy of the pattern:
➔ Opening Price: The price at the start of the timeframe
➔ Upper Shadow: The highest point the price reached (the “peak”)
➔ Lower Shadow: The lowest point the price reached (the “trough”)
➔ Closing Price: Identical to the opening price, resulting in no “real body.”
The Long Legged Doji Meaning: A Story of Extreme Indecision
We know that a standard candle tells the story of one side winning, but the long legged doji means a violent struggle that resulted in no winner. Like a game of tug-of-war, one team slowly pulls the other toward the center line. But for this pattern both teams are incredibly strong. By the end of the round, the flag is back over the center line.
What does this tell the trader?
🔹 Loss of Momentum: If the market was in a strong uptrend and this candle appears, it shows that sellers are finally fighting back with enough strength to neutralize the buyers.
🔹 Heightened Volatility: The long “legs” show that the market is becoming erratic. Big players are disagreeing on the value of the asset.
🔹 Waiting for a Catalyst: Often, this pattern appears before a major news event or earnings report, reflecting the market’s “wait and see” attitude.
How Market Participants Interpret the Long-Legged Doji Pattern?
If you saw the long-legged doji not enough to place your trade, because it represents indecision, the market could break out in either direction. You should use a strategic approach to begin your movement.
| Context is Everything | A long legged doji in the middle of a sideways range is often meaningless—it’s just more “noise.” However, look for it in these two high-probability areas: The Top of an Uptrend: It suggests that the buyers are exhausted. The Bottom of a Downtrend: It suggests the sellers have run out of steam. |
| Wait for Confirmation | The most important rule when trading the long legged doji candlestick pattern is to wait for the next candle. Upward Continuation Indication: If the next candle closes above the high of the Doji’s upper wick, it suggests increased buying interest relative to the prior session. Downward Continuation Indication: If the next candle closes below the low of the Doji’s lower wick, it signals that the bears have taken control. |
| Setting Stop-Losses | The “legs” of the Doji are so long; they provide natural levels for risk management. Market participants may evaluate risk levels if price moves beyond the range. |

Long-Legged Doji vs. Other Dojis
Here you can see some of the major differences between long legged doji and other dojis.
| Candlestick Type | Appearance | Meaning |
|---|---|---|
| Standard Doji | Small plus sign, short wicks | Mild Indecision |
| Dragonfly Doji | “T” shape, long lower wick only | Bullish reversal at bottoms |
| Gravestone Doji | Inverted “T”, long upper wick only. | Bearish reversal at tops |
| Long-Legged Doji | Large plus sign, long wicks on both sides. | Extreme volatility and major indecision. |
| Four Price Doji | Just a horizontal line no wicks | Ultimate Stasis |
Common Pitfalls to Avoid
Now you will understand the power of a long-legged doji, but many traders lose money by misinterpreting it. Avoid those mistakes you can follow the below tactics, but keep in mind that all decisions are made by your own risk.
➤ Trading without confirmation: Entering a trade the moment the Doji forms is a gamble. The “indecision” could be resolved in the direction of the original trend.
➤ Ignoring Volume: A long-legged doji on low volume is far less significant than one on high volume. High volume indicates that institutions were actively fighting for control.
➤ Small Timeframes: On a 1-minute chart, a Doji might form because only one or two trades happened. The pattern is far more reliable on Daily (D1) or Weekly (W1) charts, where it represents the collective sentiment of thousands of traders.
Conclusion: The Quiet Before the Storm
The Long-Legged Doji is the market’s way to take deep breaths before a massive move. It will capture the moment when the trend stops seeing “easy” and starts being a battle. By understanding the long legged doji candlestick and waiting for the confirmation, helps market participants remain cautious during periods of uncertainty.
Remember, in trading, sometimes the most important signal isn’t a “buy” or “sell”-it’s the signal that the market doesn’t know what to do next.
Do You Find This Interesting?
We’d Love to Hear from you-

Frequently Asked Questions
What does a long-legged doji indicate?
A long-legged doji indicates extreme indecision and high volatility. The long upper and lower wicks show that both buyers and sellers tried to take control during the session but failed, with the price eventually returning to its starting point.
Is a doji bullish or bearish?
A doji is neutral on its own. It simply represents a stalemate. However, its meaning changes based on where it appears:
◉ Bearish Signal: If it appears after a long uptrend, it suggests the bulls are exhausted.
◉ Bullish Signal: If it appears after a long downtrend, it suggests the bears are losing their grip.
◉ The “Wait” Signal: It only becomes bullish or bearish once the next candle closes above or below the doji’s range.
How reliable is a long-legged doji?
On its own, its reliability is moderate. Because it represents indecision, the price could easily continue with the previous trend after a brief pause. To make it highly reliable, traders look for:
✔ Confirmation: The next candle must close past the doji’s wicks.
✔ Volume: A spike in volume during the doji shows that major institutions were part of the struggle.
✔ Location: It is much more reliable when it forms at a major Support or Resistance level.
What timeframe is best for doji?
The Daily (D1) and Weekly (W1) timeframes are considered the best.
➢ On shorter timeframes (like 1-minute or 5-minute), dojis occur frequently due to low liquidity or “market noise,” making them less meaningful.
➢ On longer timeframes, a doji represents a full day or week of heavy combat between bulls and bears, making the eventual breakout much more significant.
What is the difference between a long-legged doji and a spinning top?
The main difference lies in the real body of the candle:
● Long-Legged Doji: Has virtually no body. The open and close prices are exactly or nearly the same. It represents a perfect tie.
● Spinning Top: Has a small, visible real body. This shows that one side (buyers or sellers) managed to gain a tiny bit of ground, though the overall sentiment remains one of indecision.
DISCLAIMER: Investment in securities market are subject to market risks, read all the related documents carefully before investing. The securities quoted are exemplary and are not recommendatory. Full disclaimer: https://bit.ly/naviadisclaimer.