Understanding the Inverse Head and Shoulders Chart Pattern: A Comprehensive Guide
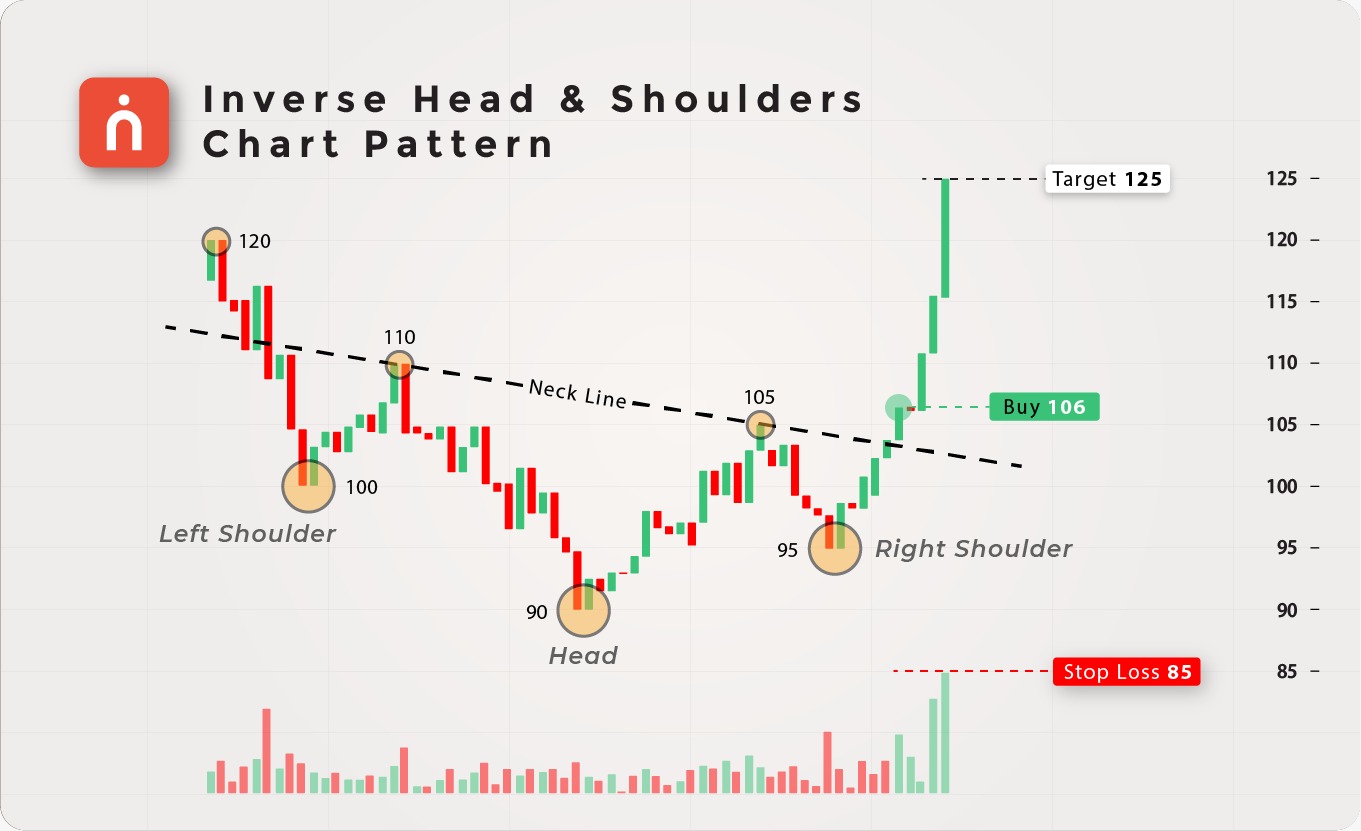
Chart patterns are crucial tools in technical analysis, enabling traders to predict potential market movements and make informed trading decisions. One of the most reliable and bullish reversal patterns is the Inverse Head and Shoulders pattern. This pattern often appears after a downtrend and signals a potential shift to an upward trend. In this blog, we will break down the Inverse Head and Shoulders pattern, explain the math and psychology behind it, and show you how to effectively use this pattern in your trading strategy. We will also provide examples in a tabular form and discuss how to use the Navia Mobile App for analyzing chart patterns.
What is the Inverse Head and Shoulders Pattern?
The Inverse Head and Shoulders pattern is a chart formation that resembles a baseline with three troughs: a deeper trough in the middle (the “head”) and two shallower troughs on either side (the “shoulders”). This pattern typically forms after a downtrend and is considered a strong bullish reversal signal. The pattern suggests that sellers are losing control, and buyers are beginning to take over, potentially leading to a new upward trend.
The Structure of the Inverse Head and Shoulders Pattern
The Inverse Head and Shoulders pattern consists of the following components:
1) Left Shoulder: The price declines to a trough and then rises to form a peak.
2) Head: The price declines again, this time forming a lower trough (the Head), and then rises.
3) Right Shoulder: The price declines once more, but this time the trough is higher than the Head, indicating weakening selling pressure.
4) Neckline: A trendline drawn connecting the peaks formed between the Head and the Shoulders. The neckline acts as a resistance level in an Inverse Head and Shoulders pattern.
The Math Behind the Inverse Head and Shoulders Pattern
The Inverse Head and Shoulders pattern is based on simple price action. Here’s how the math works:
➝ Left Shoulder: The initial trough (Left Shoulder) forms when selling pressure drives the price down, but then buying pressure causes a temporary rise.
➝ Head: The price declines further to form a lower trough (the Head). However, the subsequent rise is more pronounced, reflecting a shift in market sentiment from bearish to bullish.
➝ Right Shoulder: The final decline forms a higher trough (the Right Shoulder), indicating that selling pressure is weakening and buying pressure is gaining strength.
➝ Neckline: The neckline is the key resistance level. When the price breaks above the neckline, it confirms the pattern and signals a potential upward move.
Psychology Behind the Inverse Head and Shoulders Pattern
The Inverse Head and Shoulders pattern represents a shift in market sentiment from bearish to bullish:
➝ Left Shoulder: The market is still bearish, but the first signs of buying pressure emerge.
➝ Head: The bearish sentiment peaks, but increased buying pressure leads to a higher rise, suggesting a shift in momentum.
➝ Right Shoulder: The market attempts to decline again, but fails to reach the previous low, indicating that sellers are losing control and buyers are starting to dominate.
➝ Break of the Neckline: When the price breaks above the neckline, it signals that the buyers have taken control, and a new upward trend is likely to begin.
How to Identify an Inverse Head and Shoulders Pattern
To identify an Inverse Head and Shoulders pattern on a chart, look for the following characteristics:
1) Three Troughs: The pattern should have three distinct troughs, with the middle trough (Head) being the lowest and the other two troughs (Shoulders) being higher and roughly equal in depth.
2) Neckline: Draw a trendline connecting the two peaks between the Head and the Shoulders. This is the neckline.
3) Break of the Neckline: A break above the neckline confirms the pattern and signals a potential upward move.
Example of an Inverse Head and Shoulders Pattern
Let’s consider a practical example to illustrate the Inverse Head and Shoulders pattern:
| Stage | Price Movement | Description |
|---|---|---|
| Left Shoulder | ₹120 → ₹100 → ₹110 | The price falls to ₹100 (Left Shoulder) and then rises to ₹110. |
| Head | ₹110 → ₹90 → ₹105 | The price falls to ₹90 (Head) and then rises to ₹105. |
| Right Shoulder | ₹105 → ₹95 → ₹110 | The price falls to ₹95 (Right Shoulder) and then rises to ₹110. |
| Neckline Break | ₹110 → ₹115 | The price breaks above the neckline at ₹110 and rises to ₹115, confirming the pattern. |
Explanation:
1) The Left Shoulder forms when the price drops to ₹100 and then rises to ₹110.
2) The Head forms as the price declines further to ₹90, but then rises to ₹105.
3) The Right Shoulder forms as the price fails to reach the Head’s low, bottoming out at ₹95 before rising again to ₹110.
4) The neckline, drawn at ₹110, is broken when the price rises to ₹115, confirming the pattern and signaling a potential bullish reversal.
How to Use the Inverse Head and Shoulders Pattern in Trading
The Inverse Head and Shoulders pattern is most effective when used as a reversal signal after a downtrend. Here’s how to use this pattern in your trading strategy:
🔷 Wait for Confirmation: The pattern is not complete until the price breaks above the neckline. Wait for this confirmation before entering a trade.
🔷 Enter a Long Position: Once the neckline is broken, consider entering a long position. The break above the neckline confirms that the bullish reversal is likely to occur.
🔷 Set a Stop-Loss: Place a stop-loss order below the Right Shoulder or the Head to protect against false signals.
🔷 Target Price: The expected price movement after the neckline break can be estimated by measuring the distance from the Head to the neckline and projecting it upward from the neckline.
Practical Trading Strategy Using Inverse Head and Shoulders
Here’s a simple trading strategy that incorporates the Inverse Head and Shoulders pattern:
🔶 Identify the Pattern: Spot the Inverse Head and Shoulders pattern on a price chart.
🔶 Wait for the Neckline Break: Confirm the pattern by waiting for the price to break above the neckline.
🔶 Enter a Long Position: Buy the asset when the neckline is broken.
🔶 Set a Stop-Loss: Place a stop-loss below the Right Shoulder or Head.
🔶 Take Profit: Estimate the price target by measuring the distance from the Head to the neckline and projecting it upward from the neckline.
Example of an Inverse Head and Shoulders Trading Strategy
| Step | Action | Price Level |
|---|---|---|
| Identify Pattern | Spot Inverse Head and Shoulders at ₹95 | ₹95 |
| Wait for Confirmation | Wait for neckline break at ₹110 | ₹110 |
| Enter Long Position | Buy at ₹111 | ₹111 |
| Set Stop-Loss | Stop-loss at ₹85 (below Head) | ₹85 |
| Take Profit | Target price at ₹125 | ₹125 |
How to Use Navia Mobile App for Analyzing Chart Patterns
The Navia Mobile App is a powerful tool for traders looking to analyze chart patterns, including the Inverse Head and Shoulders. Here’s how you can use the app to enhance your trading decisions:
1) Real-Time Charting Tools: The Navia Mobile App offers real-time charting tools that allow you to easily spot patterns like the Inverse Head and Shoulders. You can customize your charts with different time frames and indicators.
2) Pattern Recognition: Use the app’s pattern recognition features to automatically identify key patterns, saving time and ensuring you don’t miss critical signals.
3) Backtesting Strategies: The app allows you to backtest your strategies based on historical data, helping you refine your approach and see how the Inverse Head and Shoulders pattern has performed in the past.
4) Risk Management Tools: Navia’s built-in risk management tools help you set stop-loss and take-profit levels based on your strategy, ensuring that you manage your risk effectively.
Summary Table: Inverse Head and Shoulders Pattern at a Glance
| Feature | Description |
|---|---|
| Shape | Three troughs, with the middle trough (Head) being the lowest and the two side troughs (Shoulders) being higher |
| Signal | Bullish reversal, typically appears after a downtrend |
| Psychology | Indicates that the selling pressure is weakening and buyers are gaining control |
| Best Use | Most effective at the bottom of a downtrend, signals potential reversal |
| Confirmation Needed | Wait for a break of the neckline before entering a trade |
| Risk Management | Use stop-loss orders below the Right Shoulder or Head to protect against false signals |

Conclusion
The Inverse Head and Shoulders pattern is a powerful tool for traders looking to identify potential market reversals. By understanding the math and psychology behind this pattern, and combining it with other technical indicators and confirmation signals, traders can make more informed decisions and improve their trading strategies. The Navia Mobile App further enhances your ability to analyze and act on chart patterns, providing you with the tools and real-time data necessary for successful trading.
Whether you’re a beginner or an experienced trader, mastering the Inverse Head and Shoulders pattern and incorporating it into your trading strategy can help you navigate the markets more effectively and achieve your financial goals. Happy trading!
We’d Love to Hear from you-
DISCLAIMER: Investments in the securities market are subject to market risks, read all the related documents carefully before investing. The securities quoted are exemplary and are not recommendatory. Brokerage will not exceed the SEBI prescribed limit.
