

Striking the Bottom: Mastering the Bullish Hammer Candlestick Pattern
- What is the Hammer Candlestick Pattern?
- Psychology Behind the Hammer in Candlestick Pattern
- Inverted Hammer Candlestick Patterns: A Different Take on Reversal
- Executing Hammer and Inverted Hammer Patterns
- Conclusion
- Frequently Asked Questions
In the world of chart analysis, traders are consistently searching for clear signs that a downward trend is losing steam, and a bullish reversal is imminent. Few signals are powerful, easy to spot and instantly recognizable like the hammer candlestick pattern. The hammer in candlestick pattern is one of the ways of marketing; announcing aggressive selling during the session.
It’s a distinct shape resembling a hammer that sends a strong signal that the market may have hit a durable bottom. If you’re an investor and looking to find reliable entry points after a decline, understanding the hammer candlestick patterns is essential. This guide will provide a comprehensive breakdown of the hammer and its close, explaining the psychology and structure in detail.
What is the Hammer Candlestick Pattern?
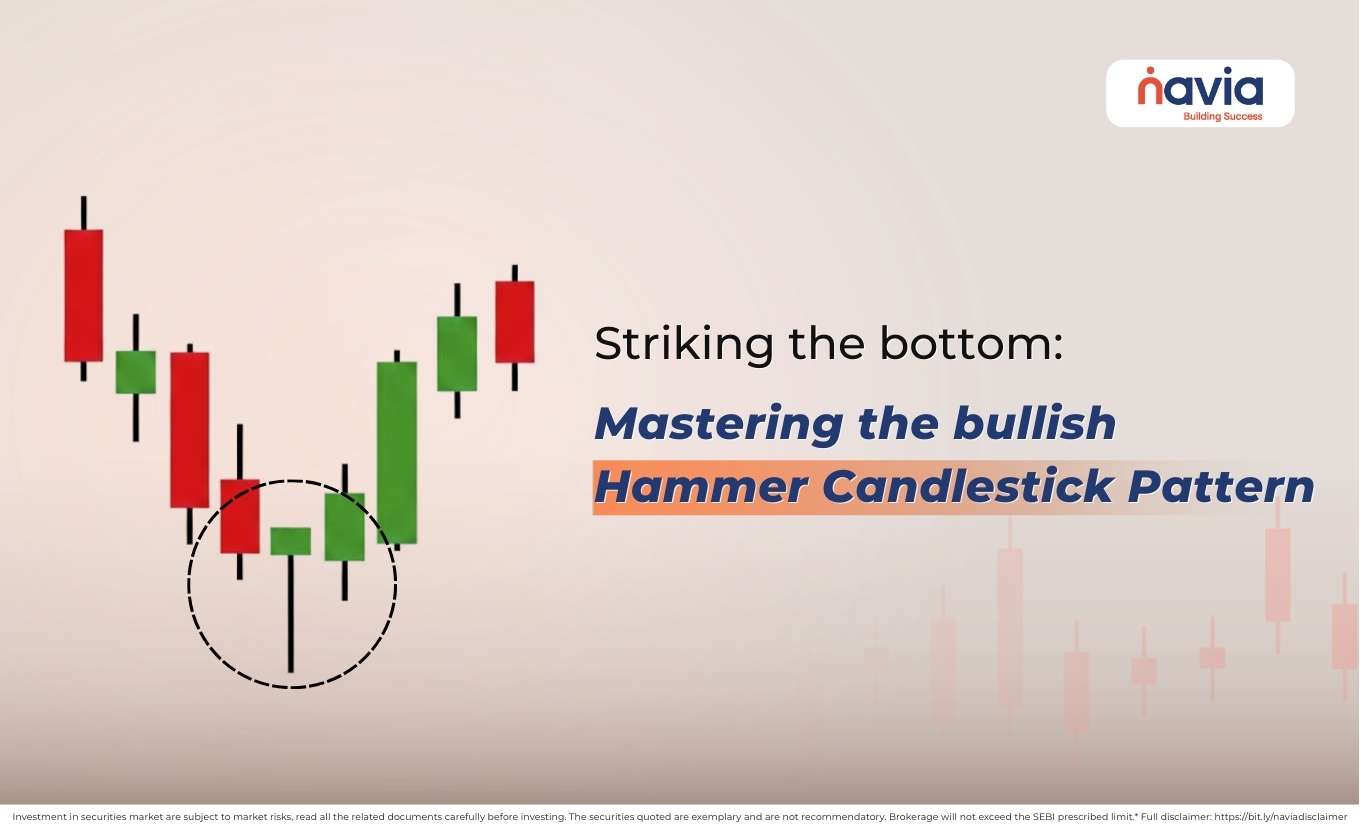
The hammer candlestick pattern is a single-candle bullish reversal pattern that forms at the bottom of a downtrend. It signals that the downtrend is likely ending, paving the way to a new uptrend. And the structure of the candlestick hammer pattern tells you a story of immediate rejection of power prices.
Let’s see the anatomy of the hammer;
A valid candle hammer pattern is defined by three key characteristics:
| Small Real Body at the Top | The candle has a very small real body, that is positioned near the high of the session. |
| Long Lower Shadow (The Handle) | This lower wick must be at least two times the length of the real body. And it shows that selling pushed the price significantly lower, but the price was aggressively rejected and returned to the top. |
| Little to No Upper Shadow | It should be minimal or no shadow above the real body. |
The color of the hammer’s real body is less important than its shape, but it can enhance the signal:
🔸 Green/White Body (Bullish): Means the close is higher than the open, it is slightly stronger signal, as it shows that buyers not only recovered the selling but finished the session with a net gain.
🔸 Red/Black Body (Bearish): Means the close lower than the open; this pattern still valid because the long lower wick confirms the rejection of lower prices, which is the primary message.
Psychology Behind the Hammer in Candlestick Pattern
The price action of the hammer in candlestick pattern narrated the moment of capitulation by sellers and the entry of strong buyer support.
| Continuation of the Downtrend | The session begins with the price either opening where it closed or gapping down, continuing the bearish sentiment. |
| Seller Aggression (The Plunge) | Sellers push the price aggressively lower; that creates a long lower shadow. This drop causes panic, and many weaker holders sell their positions. |
| Buyer Intervention (The Recovery) | Powerful buyers deal with the sharply reduced price as an extreme bargain. So, they step in and buy back the stock, pushing the price all the way back up to close near the open or even above it. |
| The Reversal Signal | The resulting shape is the hammer-that shows the fact of the market violently rejected the lower prices. It also confirms that a new support floor has been established, and the downtrend has likely reached exhaustion. |

Inverted Hammer Candlestick Patterns: A Different Take on Reversal
Now we understood that the hammer shows buyers pushing the price up from the low, the inverted hammer candlestick patterns show buyers pushing the price before it close, that create a difference but equally to bullish signal.
Let’s see the anatomy of the inverted hammer;
| Small Real Body at the Bottom | The real body is small and positioned near the low of the session. |
| Long Upper Shadow | The upper wick must be at least two times the length of the real body; that shows that buyers attempted to push the price up aggressively during the session but were met with selling pressure that pushed the price back down to close near the open. |
| Little to No Lower Shadow | Minimal or no shadow below the real body. |
The inverted hammer signifies that the buyers are testing the resolve of the sellers. The long upper shadow is considered as the buyer’s first attempt to start the rally. Although they failed to hold the high by the close, they successfully tested the high prices that show how much the buyers are active and influential. And this pattern signals a weaker signal than the standard hammer but still a valid bullish reversal indicator.
Executing Hammer and Inverted Hammer Patterns
Both hammer candle pattern and the inverted hammer patterns are powerful, but before making a decision it requires confirmation.
| Context and Confirmation | Ensure the pattern forms at the bottom of a clear downtrend. Never trade based on the singe candle alone, you can confirm it with the next candle (the confirmation candle) is bullish and closes above the high of the hammer/inverted hammer’s small real body. |
| Entry and Stop-Loss | After the confirmation, Entry: Enter a long position when the price breaks and closes above the high of the signal candle’s small real body. Stop Loss: Place your stop-loss order below the low of the long shadow; that represents the market’s absolute rejection point; if the price falls below this, the reversal signal is invalidated. Take Profit: Target the nearest significant resistance level from prior price action or use a trailing stop-loss to manage the trade. |
Conclusion
The candle hammer pattern and its inverted counterpart are invaluable tools for identifying market bottoms. But you must understand the formation, psychology of the reversal and apply strict confirmation rules then only make your movement. Following these steps will help you to find high-probability entry points and strike profits at the moment the trend turns.
Do You Find This Interesting?
We’d Love to Hear from you-

Frequently Asked Questions
Is a hammer bullish or bearish?
The Hammer Candlestick Pattern is definitively bullish. It forms a downtrend and signals a strong probability of a bullish reversal, meaning the price is likely to move higher.
What does the hammer candle pattern indicate?
The hammer candle pattern indicates a forceful rejection of lower prices and the establishment of a potential market bottom. Specifically, it shows that:
➤ Sellers aggressively drove the price down to a new low during the session (creating the long lower shadow).
➤ Buyers then entered the market with overwhelming strength, absorbing all the selling pressure and pushing the price back up to close near the high of the session (creating the small body at the top).
This reversal of momentum suggests that the sellers are exhausted, and buyers have taken control of the sellers.
How to confirm a hammer candlestick?
The Hammer pattern itself is just a warning; confirmation is required for a high-probability trade:
⦿ Location: Ensure it forms at the bottom of a clear downtrend or at a major support level.
⦿ Confirmation Candle: The signal is confirmed if the next candle (the confirmation candle) is bullish (green) and closes above the real body of the Hammer. This bullish follow-through confirms that the buyers are committed to driving the price higher.
⦿ Volume: Look for high trading volume on the confirmation candle, which validates the strength of the breakout.
Is Hammer a good buy signal?
Yes, the Hammer is considered a good buy signal, provided it is properly confirmed and placed in the right context. Traders often place a buy order after the confirmation candle closes, with a stop-loss just below the low of the Hammer’s long shadow.
What timeframe is best for hammer patterns?
The reliability of hammer patterns increases significantly on longer timeframes.
✔ Best Timeframes: Daily and weekly charts provide the most reliable signals, as the pattern represents a decisive reversal over a longer, more meaningful trading period.
✔ Intraday Trading: While hammers appear on intraday charts (e.g., 5-minute or 1-hour), they are prone to market noise and can produce more false signals. If used intraday, they should be combined with strong resistance/support levels and highly reliable volume indicators.
What is the success rate of the hammer pattern?
The exact statistical success rate of the Hammer Pattern varies widely depending on the market, timeframe, and confirmation of rules used. However, it is considered one of the highest-probability single-candle reversal patterns in technical analysis.
DISCLAIMER: Investment in securities market are subject to market risks, read all the related documents carefully before investing. The securities quoted are exemplary and are not recommendatory. Full disclaimer: https://bit.ly/naviadisclaimer.


