

The Dragonfly Doji: Spotting Reversals When the Market Takes Flight
- What is Dragonfly Doji Candlestick Pattern?
- Market Story Behind the Dragonfly Doji Candle Pattern
- Where to Spot a High-Probability Dragonfly Doji?
- Dragonfly Doji and Gravestone Doji: Two Sides of the Same Coin
- Execute Your Dragonfly Doji Entry
- Conclusion
- Frequently Asked Questions
In this confusing world of financial charts, candlestick patterns offer traders a unique way to understand market psychology. Among these, dragonfly doji stands out as a powerful visual signal, that whisper traders that a significant reversal is about to take wing.
Imagine that a market has been relentlessly falling, pushing prices lower and lower. Just when despair sets in, a peculiar candle appears, one that looks like a dragonfly. It signals that the seller’s strength is waning, and can indicate buyers are swooping in to lift the price.
This blog will help you understand the candlestick dragonfly doji by analyzing its definition, market story, and how you can use this potent signal to make smarter trading decisions.
What is Dragonfly Doji Candlestick Pattern?
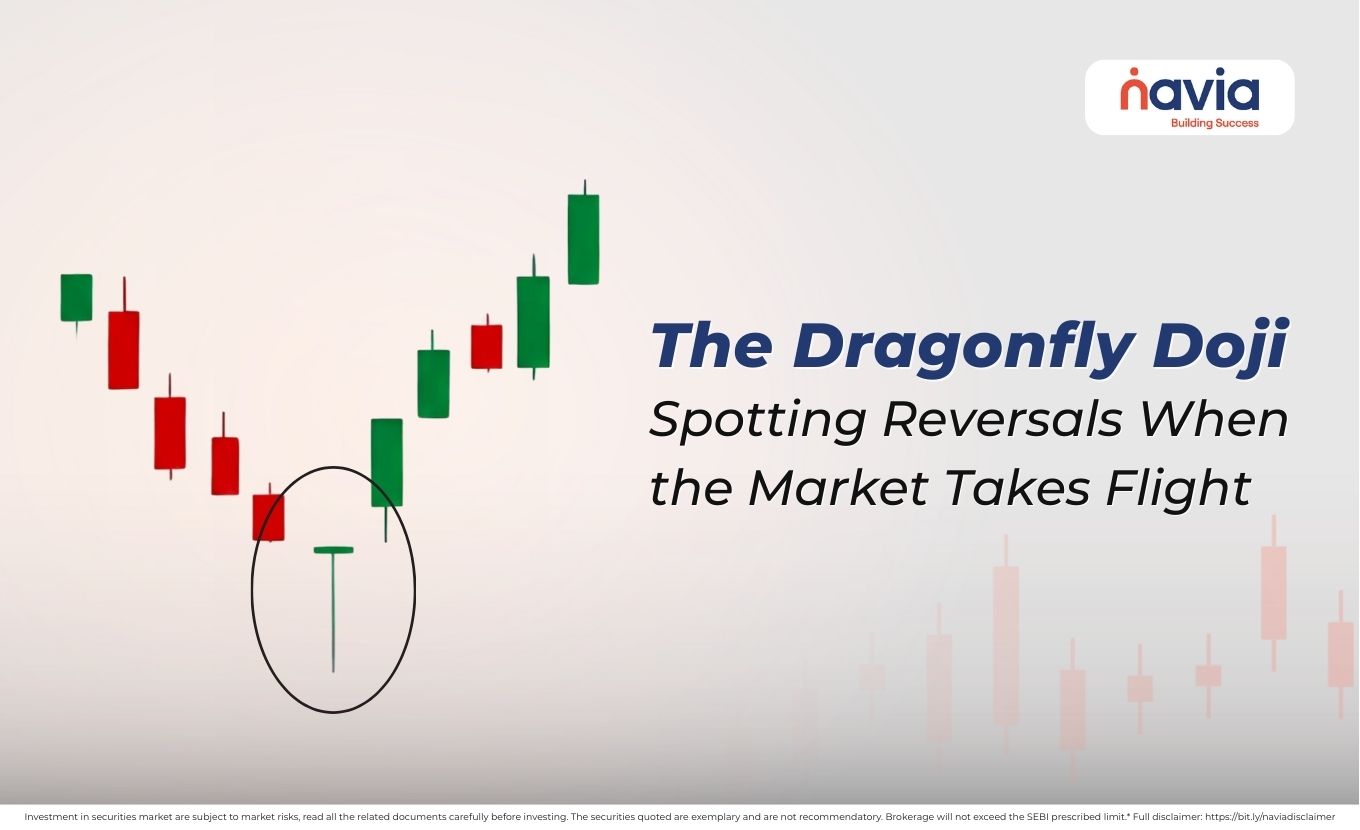
Exactly, what is dragonfly doji? It’s a single-candlestick pattern that typically appears at the bottom of a downtrend, signaling a potential bullish reversal. You can find that it’s a unique shape that makes it easy to spot:
🟠 Long Lower Shadow: It shows that sellers initially pushed the price down significantly during the trading period.
🟠 No or Very Small Upper Shadow: The price did not move much above the open/close.
🟠 Open, High, and Close are Identical (or Nearly Identical): This is the “Doji” part. The session opens, price drops, but then buyers push it all the way back up to close at or very near the opening price, which is also the high price for that period.
The dragonfly doji candlestick pattern visually resembles a “T” with a long tail and no body. This shape is considered a critical clue to the underlying market dynamics.
Market Story Behind the Dragonfly Doji Candle Pattern
You must appreciate the power of the candlestick dragonfly doji, first you need to understand the intense battle between buyers and sellers that creates its unique form. Here you can see the break down the trading session where a dragonfly doji forms:
| The Opening Bell | The session begins, or the candle period starts. |
| Sellers Take Control (Initially) | Almost immediately, the sellers dominate. They push the price aggressively lower, creating a long lower shadow. This shows a strong bearish push, extending the existing downtrend. |
| Buyers Stage a Comeback | However, this downward push is met with an equally powerful surge of buying interest. Buyers step in with force, seeing the lower prices as an attractive opportunity. They aggressively buy back the asset, pushing the price steadily upward. |
| The Stalemate | By the time the session closes, the buyers have managed to push the price all the way back up to the opening price (or very close to it). Crucially, the price also closes at or near the high of the session, indicating that the buying momentum was incredibly strong into the close. |
The sequence tells us that a bearish attack, the buyers are completely neutralizing it, ending the period exactly where it started. It’s a strong sign of seller exhaustion and buyer strength.
Where to Spot a High-Probability Dragonfly Doji?
A dragonfly doji is most reliable when it appears in the right context. Here’s what to look for:
🔸 At the Botton of a Downtrend: It’s non-negotiable, because if a Dragonfly Doji appears after a prolonged period of falling prices, its reversal signal is much stronger.
🔸 Near Key Support Levels: A Dragonfly Doji forms precisely at a major support level; its power is amplified. It shows that buyers are stepping in exactly where the market is expected to find a floor.
🔸 With High Volume: A significant increase in trading volume on the candle forming the Dragonfly Doji adds tremendous confirmation. High volume during this reversal indicates that a large number of participants are involved in rejecting lower prices, making the reversal more credible.

Dragonfly Doji and Gravestone Doji: Two Sides of the Same Coin
If you want to fully understand the dragonfly doji, it’s essential to know its opposite too: that is gravestone doji. These two patterns are mirror images of each other, let’s see in-depth of these two sides;
| Dragonfly Doji (Bullish Reversal) | Gravestone Doji (Bearish Reversal) |
|---|---|
| Shape: “T” shape with a long lower shadow. Context: Appears at the bottom of a downtrend. Meaning: Sellers initially push the price down, but buyers reclaim control, pushing the price back to the open/high. Is often interpreted as a potential move upward. Psychology: Seller exhaustion, strong buyer rejection of lower prices. | Shape: Inverted “T” shape with a long upper shadow. Context: Appears at the top of an uptrend. Meaning: Buyers initially push the price up, but sellers overwhelm them, pushing the price back down to the open/low. Is often interpreted as a potential move downward. Psychology: Buyer exhaustion, strong seller rejection of higher prices. |
It is necessary to understand both the dragonfly doji and gravestone doji gives you a comprehensive view of how market sentiment can suddenly shift at critical turning points.
Execute Your Dragonfly Doji Entry
We know that spotting the candlestick dragonfly doji is just a beginning stage; the real skill lies in the planning of your trade.
| Entry Point | Some traders enter a long position immediately on the next candle open after the Dragonfly Doji closed. A safer approach is to wait for the next candle to close above the high of the Dragonfly Doji. |
| Stop-Loss Placement | Place your stop-loss order below the low of the Dragonfly Doji’s long lower shadow. This point represents the ultimate support level that buyers defended. |
| Profit Targets | Common profit targets include the next major resistance level, a previous swing high, or using a fixed risk-to-reward ratio. |
While the dragonfly doji candlestick pattern is powerful, no single indicator is reliable, always use other technical analysis tools.
Conclusion
Dragonfly doji is a highly effective candlestick pattern that provides a clear insight into market dynamics. The “T” shape of it, characterized by a long lower shadow and a virtually absent real body, shows the market’s strong rejection of lower prices.
First you understand what is dragonfly doji, recognize its formation and combine it with other confirmation signals, you can enhance your ability to spot the bullish reversals easily. Remember, like any trading tool, it requires practice, patience, and strict risk management.
Do You Find This Interesting?
We’d Love to Hear from you-

Frequently Asked Questions
Is a dragonfly doji bullish or bearish?
The Dragonfly Doji is primarily considered a bullish reversal pattern, especially when it appears at the bottom of a downtrend.
What does a dragonfly candle indicate?
A dragonfly candle indicates a massive rejection of lower prices. It shows that during the trading session, sellers aggressively pushed the price down, but by the end of the session, buyers flooded the market and pushed the price back up to the opening level.
How reliable is a dragonfly doji pattern?
The reliability of a Dragonfly Doji is moderate to high, provided it is confirmed by the following candle. On its own, the pattern is just a warning of potential change:
◾ Higher Reliability: When it occurs at a major support level or in “oversold” conditions.
◾ Lower Reliability: When the lower shadow is short or when it appears in a choppy, sideways market.
What happens after a dragonfly doji?
After a Dragonfly Doji, the market typically experiences a trend of reversal or a strong price to bounce. However, traders usually wait for a “confirmation candle.”
What timeframe is best for a dragonfly doji?
The Dragonfly Doji is most effective on longer timeframes, such as the Daily or Weekly charts. On these timeframes, the pattern represents a significant shift in institutional sentiment.
DISCLAIMER: Investment in securities market are subject to market risks, read all the related documents carefully before investing. The securities quoted are exemplary and are not recommendatory. Full disclaimer: https://bit.ly/naviadisclaimer.


