

Sudden Impact: Mastering the Bullish Kicker Pattern for Explosive Reversals
- What is the Bullish Kicker Candlestick Pattern?
- The Psychology: Why the "Kicker" is So Powerful
- Trading the Bullish Kicker: Strategic Execution
- Common Pitfalls: When the Kicker Fails
- Differences Between Bullish Kicker and Bullish Engulfing
- Conclusion: Don't Get Left Behind
- Frequently Asked Questions
In the high-velocity trading world of 2026, where algorithms and institutional “whales” can shift market sentiment in milliseconds, the ability to spot a sudden power shift is priceless. Many traders wait for slow and multi-candle confirmation; the bullish kicker pattern stands as one of the most reliable signals of a total trend takeover.
If you’ve ever seen a stock gap up and leave everyone behind, you likely witnessed a bullish kicker in action. So, understanding this pattern isn’t just about reading charts; it’s about understanding the “shock” to the system when bears are instantly wiped out by a wave of buying.
What is the Bullish Kicker Candlestick Pattern?
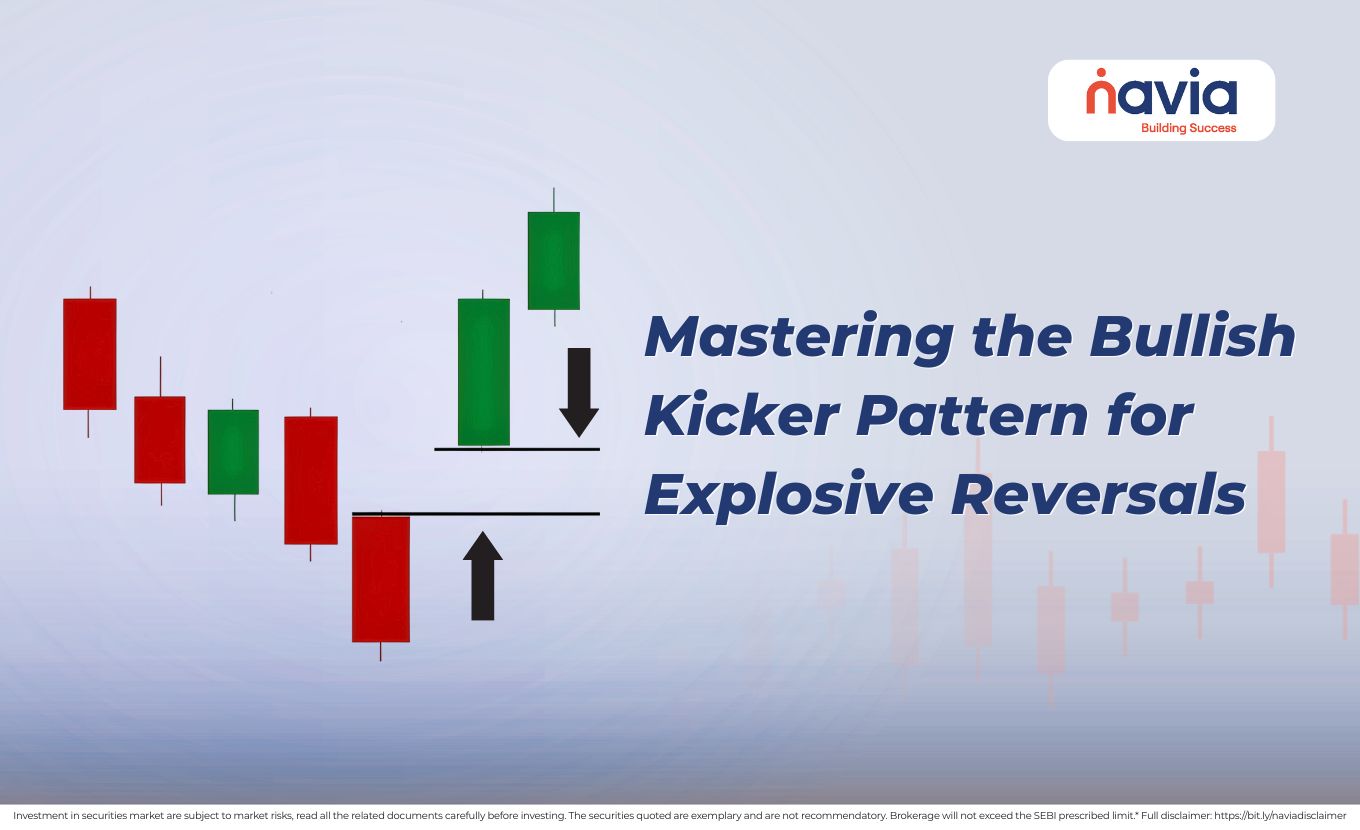
Bullish kicker pattern is a two-candle reversal formation that visually represents a “kick” to the market’s current direction. It is a unique signal because it often completely ignores the previous candle momentum, creating a gap that never gets filled.
How does it identify? To identify a valid bullish kicker candlestick, you need to look for some specific criteria, that are given below;
| The Bearish Anchor | The first candle is a strong, long-bodied bearish candle. This indicates that the bears are currently in complete control, and the downtrend is active. |
| The Gap Up | The second candle opens with a significant gap higher. Crucially, it opens at or above the opening price of the previous day’s bearish candle. |
| The Bullish Surge | This second candle is a strong, long-bodied bullish candle that continues to move upward throughout the session. |
The Psychology: Why the “Kicker” is So Powerful
The reason for considering the bullish kicker candlestick pattern as a powerful than other reversal signal lies in the psychological shock that delivers to traders.
Day 1, everyone is pessimistic. At that time short sellers are adding to their position, and long-term holders are become panic. The sudden “kick”, due to massive news events or institutional buying, the market opens much higher the next day.
Every single person who sold or shorted on Day 1 is now “underwater”. They are forced to buy back their shares immediately to cover their losses, which fuels the upward fire. Because the kicker candle pattern requires such a massive shift in price without any overlap, it signifies that the bulls didn’t just win a battle; they won the entire war in a single move.
Trading the Bullish Kicker: Strategic Execution
Spotting a bullish kicker is the first step but trading it without a disciplined plan will make you disappoint. Here you can see how professional traders handle this explosive move (educational purpose only).
| Volume Confirmation | A bullish kicker without volume is just a fluke. For the pattern to be valid, the second bullish candle must be accompanied by a surge in volume. This confirms that a lot of money is driving the move, not just a thin market order. |
| Entry and Stop-Loss | Entry: Most traders enter at the close of the second (bullish) candle. If the momentum is particularly strong, you can enter at the opening of the third candle. Stop-Loss: Place your stop-loss just below the low of the first (bearish) candle or, more aggressively, just below the gap itself. |
| Time Frame Context | The bullish kicker pattern is most reliable on the Daily (1D) and Weekly (1W) timeframes. In shorter timeframes like the 5-minute chart, “fake” gaps can occur frequently due to low liquidity, leading to false signals. |

Common Pitfalls: When the Kicker Fails
If the bullish kicker candlestick pattern is the strongest pattern but remember those aren’t 100% foolproof. Some of the red flags of it given below;
🔸If the price starts to slide back and fills the gap within a few sessions, the bullish kicker has failed. The gap acts as your “line in the sand.”
🔸If the market is already severely overbought, a kicker might be an “exhaustion” gap—a final frantic surge before a crash. Always check indicators like the RSI for overbought conditions.
🔸Kickers are almost always driven by the news. If the news event is a “one-off” and doesn’t change the long-term fundamentals, the initial spike may be sold off by institutional traders.
🔸Many traders place their stop-loss exactly at the gap edge. However, minor volatility often “wicks” into the gap before the rally continues.
🔸Even a perfect bullish kicker can fail if the broader market (like Nifty 50) is in a freefall. Always check if the sector and the overall market trend support a bullish move.
Differences Between Bullish Kicker and Bullish Engulfing
| Feature | Bullish Engulfing | Bullish Kicker |
|---|---|---|
| Opening Price | The 2nd candle opens lower than (or equal to) the 1st candle close. | The 2nd candle opens at or above the 1st candles open. |
| The Gap | Typically involves a “downward gap” that is immediately recovered. | Involves a massive upward gap that is rarely filled immediately. |
| Psychology | Shows bulls “winning a fight” that started at the lows. | Shows a “knockout” where the bears didn’t even get to fight. |
| Reliability | High, but usually requires a third candle for confirmation. | Extremely High; it is considered one of the strongest signals in technical analysis. |
| Visual Shape | A “Big brother” (Bull) swallowing a “Small brother” (Bear). | Two separate candles “kicking” away from each other in opposite directions. |
| Trend Speed | Signals for a steady, sustainable trend reversal. | Signals are an explosive, immediate move that often leaves traders behind. |
Conclusion: Don’t Get Left Behind
The bullish kicker pattern is more than just two candles on a screen; that visually represents the “shock” to the system. In this 2026 trading landscape, information flows instantly and sentiment can pivot on a single headline. The kicker acts as the market’s loud and clear announcement of a change of plans.
By mastering this pattern, you aren’t just looking for “green candles”; you are identifying a moment of absolute conviction where the bulls have completely evicted the bears from the driver’s seat. So, make decisions effectively by understanding the concept.
Do You Find This Interesting?
We’d Love to Hear from you-

Frequently Asked Questions
What is a bullish kicker pattern?
A bullish kicker pattern is a two-candle reversal signal that shows a sudden and violent shift from bearish to bullish sentiment.
➢ It starts with a long bearish candle.
➢ The next day, the price gaps up and opens at or above the previous day’s opening price.
➢ The second candle then closes as a long bullish candle.
➢ There is no overlap between the bodies of the two candles. It is a “knockout” move where the bulls take immediate control.
What is the difference between bearish kicker and bullish kicker?
The difference lies in the direction of the “shock” and the trend it reverses:
| Feature | Bullish Kicker | Bearish Kicker |
|---|---|---|
| Prior Trend | Downtrend | Uptrend |
| Candle 1 | Long Bearish (Red) | Long Bullish (Green) |
| The Gap | Gaps Up | Gaps Down |
| Candle 2 | Long Bullish (Green) | Long Bearish (Red) |
| Meaning | Explosive Bullish Reversal | Violent Bearish Reversal |
What is the strongest bullish pattern?
While “strength” can be subjective, the Bullish Kicker is widely considered the strongest because it involves a gap and zero indecision. However, in terms of reliability, many traders look for the Three Outside Up or Morning Star because they provide three candles of confirmation, making them less prone to “fakeouts” than single or double candle patterns.
Which candle is best for day trading?
In day trading, there is no single “best” candle; rather, the best candle is the one that provides the highest contextual clarity for your specific strategy. Because day trading involves high volatility and “noise,” professional traders typically look for candles that signify a clear rejection of price or a surge in momentum
What is the kicker pattern?
The kicker pattern is a general term for a two-bar formation where the second bar opens with a gap in the opposite direction of the first bar’s move. It is characterized by extreme momentum. It indicates that a significant piece of news or a massive institutional order has completely overwritten the previous market sentiment, leaving those on the wrong side of the trade “trapped” and forced to exit quickly.
DISCLAIMER: Investment in securities market are subject to market risks, read all the related documents carefully before investing. The securities quoted are exemplary and are not recommendatory. Full disclaimer: https://bit.ly/naviadisclaimer.


