A Deep Dive into the Bearish Three Outside Down Pattern
- What is the Three Outside Down Pattern?
- Anatomy of the Three Outside Down Candle Pattern
- Market Psychology: Why It Works
- Strategies for Trading the Three Outside Down Pattern
- Common Pitfalls and How to Avoid Them
- Conclusion: Adding the Pattern to Your Toolkit
- Frequently Asked Questions
In the world of technical analysis, timing is the difference between a successful trade and a costly mistake. For traders operating in the volatile markets of 2026, the ability to spot a trend of exhaustion before it collapses is a superpower. While many patterns hint at a slowdown, few are as decisive as the three outside down candlestick pattern.
This pattern serves as a definitive “red flag” for bulls and a “green light” for short sellers. By understanding the psychology and structure of the three outside down candle pattern, you can protect your portfolio from sudden downturns and capitalize on the shift in market momentum.
What is the Three Outside Down Pattern?
The three outside down candlestick pattern is a three-bar bearish reversal formation that typically occurs at the peak of an uptrend. It is essentially an extension of the “Bearish Engulfing” pattern, providing an extra day of confirmation to ensure the reversal is genuine.
In technical terms, it is the opposite of the Three Outside Up pattern. While many traders rely on indicators like the RSI or MACD, price action purists often prefer this pattern because it shows a real-time shift in power from buyers to sellers without any lag.
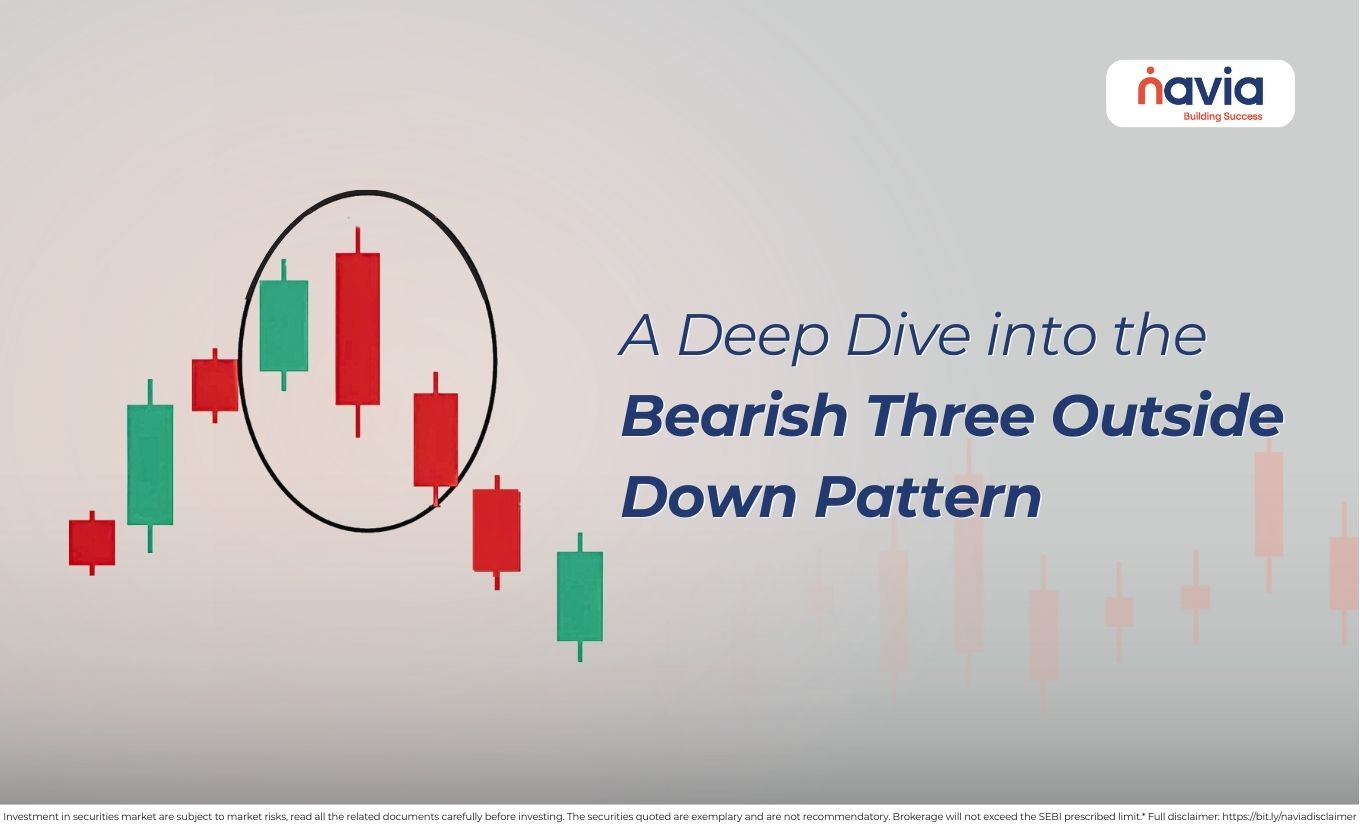
Anatomy of the Three Outside Down Candle Pattern
To trade this signal effectively, you must see all three components aligned in a specific sequence. Each candle represents a psychological shift in the market participant’s mindset.
| The First Candle: The Final Rally | The pattern begins with a small bullish (green/white) candle. This candle appears to be a continuation of the existing uptrend. However, the small size of the body suggests that the “bulls” are losing steam. The buying pressure is still present, but it is no longer aggressive. |
| The Second Candle: The Power Shift (The Engulfing) | The second candle is the heart of the pattern. It is a large bearish (red/black) candle that opens above the close of the first candle and closes significantly below the open of the first candle. This “engulfs” the previous day’s price action. It indicates that the sellers have entered the market with overwhelming force, erasing all the gains of the previous period. |
| The Third Candle: The Confirmation | The third candle is another bearish candle that closes below the close of the second candle. This is the “nail in the coffin” for the uptrend. It confirms that the bearish momentum wasn’t just a one-day fluke but a sustained change in trend. |
Market Psychology: Why It Works
Understanding the “why” behind the three outside down candlestick pattern is just as important as the “what.”
🔶 Day 1: Optimism remains. The trend is up, and investors are still buying, but the conviction is low.
🔶 Day 2: A “Bear Trap” often occurs. The price might open higher, enticing late-stage buyers to enter. Suddenly, heavy institutional selling began. The price crashes through the previous day’s open, triggering stop-losses and creating a panic-selling environment.
🔶 Day 3: The panic continues. As the price breaks below the lows of the engulfing candle, more traders realize the trend has flipped. They exit their long positions, and short sellers add to the downward pressure.

Strategies for Trading the Three Outside Down Pattern
In 2026, where algorithmic trading can cause “fakeouts,” having a disciplined entry and exit strategy is vital. Here are some of the strategies (educational purpose only) for trading in three outside down patterns.
| Entry Point | The most reliable entry point is at the close of the third candle. By waiting for the close, you ensure that the three outside down candle pattern has fully formed and hasn’t reversed back into the range. |
| Stop-Loss Placement | Place your stop-loss just above the high of the second candle (the engulfing candle). If the price moves back above this peak, it suggests that the bears have failed to hold their ground, and the bearish thesis is invalidated. |
| Profit Targets | Reversal patterns often lead to significant downtrends. Look for previous support levels or use a Fibonacci retracement tool to identify potential target zones. A common strategy is to aim for a 2:1 or 3:1 reward-to-risk ratio. |
Common Pitfalls and How to Avoid Them
Even the most reliable patterns can fail. Here is what to watch out for:
➣ The “Wait” Period: Many traders get impatient and enter Day 2. Without Day 3 confirmation, you might be caught in a “minor correction” rather than a “reversal.”
➣ Context Matters: If the pattern forms in the middle of a sideways/choppy market, it has very little predictive power. It is most effective only after a clear, prolonged uptrend
➣ Support Levels: If the pattern forms right on top of a major long-term support level, the bears might struggle to break through, leading to a “double bottom” instead.
Conclusion: Adding the Pattern to Your Toolkit
The three outside down candle pattern is a gift to the disciplined trader. It doesn’t ask you to guess; it asks you to observe. By waiting for the three-day sequence to complete, you are allowing the market to prove its bearish intent before you risk your capital.
As trading and technology continue to evolve in 2026, price action patterns like this remain the most honest indicators of market sentiment. Whether you are an intraday trader or a long-term investor, recognizing the three outside down candlestick pattern can help you exit the market before the “mat” is pulled from under your feet.
Do You Find This Interesting?
We’d Love to Hear from you-

Frequently Asked Questions
What does the three outside down candlestick mean?
The three outside down candlestick pattern is a “confirmation” signal that an uptrend has ended, and a downtrend has begun. It represents a three-stage psychological shift:
🔹 Stage 1: A final, weak push by the bulls (small green candle).
🔹 Stage 2: An aggressive takeover by the bears that “engulfs” the previous day (large red candle).
🔹 Stage 3: A panic sell-off where the price breaks to new lows (the confirmation candle).
Which is the most successful candlestick pattern?
There is no single “magic” pattern, but in terms of statistical reliability, three-candle patterns like the Evening Star and the Three Outside Down often have higher success rates than single-candle patterns. This is because they require a confirmation bar (the third candle), which filters out “fakeouts” and temporary market noise.
What is the pattern of three outside up candles?
The Three Outside Up is the bullish mirror image of the Three Outside Down. It signals a reversal from a downtrend to an uptrend:
▶ First Candle: A small bearish (red) candle in a downtrend.
▶ Second Candle: A large bullish (green) candle that completely engulfs the body of the first candle.
▶ Third Candle: A bullish candle that closes higher than the second candle, confirming the new upward momentum.
When is the best time to trade with the Three Outside Down pattern?
The “best time” is defined by context rather than a clock. This pattern is most successful when:
◆ At Resistance: It forms near a major historical resistance level or a “round number”.
◆ Overbought Conditions: Technical indicators like the RSI are above 70, showing the market is “expensive.”
◆ High Volume: The second and third candles of the pattern show a significant increase in trading volume, indicating that “big players” are selling.
Is the Three Outside Down pattern a bullish reversal?
No. The Three Outside Down is a bearish reversal pattern. It marks the transition from a bullish market (rising prices) to a bearish market (falling prices). If you are looking for a bullish reversal (bottom-fishing), you should look for the Three Outside Up pattern instead.
DISCLAIMER: Investment in securities market are subject to market risks, read all the related documents carefully before investing. The securities quoted are exemplary and are not recommendatory. Full disclaimer: https://bit.ly/naviadisclaimer.