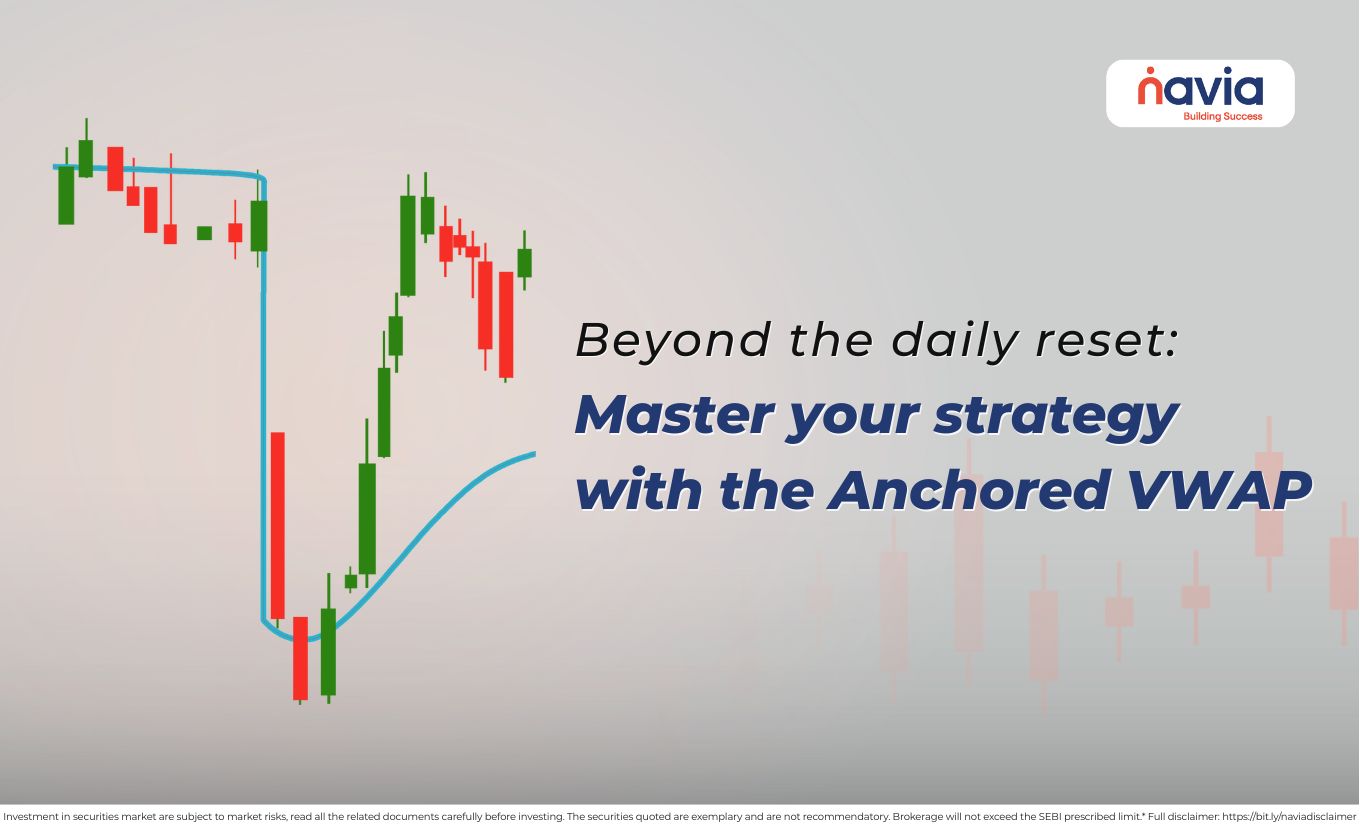
Beyond the Daily Reset: Master Your Strategy with the Anchored VWAP
- What is the Anchored VWAP?
- Using Anchored VWAP for Market Analysis
- Anchored VWAP vs. Moving Averages
- Common Mistakes to Avoid
- Conclusion
- Frequently Asked Questions
Many traders using standard Volume-Weighted Average Price (VWAP) is a staple of their intraday charts. It is considered the “fair value” that helps determine if you’re buying a premium or getting a deal. But there is a limitation: traditional VWAP resets every single morning. What happens if a massive trend started three days ago after an earnings report? Or what if a stock has been trending since the first of the year?
This is where anchored vwap comes into play. It allows you to pick up the exact starting point of the calculation; this tool adds broader market context to intraday price analysis.
What is the Anchored VWAP?
The anchored vwap is a technical analysis indicator that calculates the average price of an asset, weighted by volume, starting from a specific point in time chosen by the trader. While the standard VWAP tied to the market open, the anchored version is tied to a significant event, such as;
✅ Major swing highs or lows
✅ Earnings announcements
✅ Significant news events
✅ Start of a month, quarter or year
When you use the anchored vwap indicator, you are asking: “What is the average price paid by every trader who has entered this stock since this specific event happened?”
Why the “Anchor” Matters?
The anchoring vwap power lies in market psychology. A major event like earnings report changes the sentiment of stock. The people who buy after that report are part of a “new” group of investors; by anchoring the calculation to that date you can see the average cost basis of that specific group.
If the price remains above that line, the majority of participants who entered after the earnings report have a favorable cost basis. If it dips below, they are positioned below their average traded price.
Using Anchored VWAP for Market Analysis
To reach maximum trading gains with anchored vwap, you shouldn’t just slap a line on a chart and hope for the best. Here you can see three commonly used analytical approaches:
Note: The strategies discussed below are for educational purposes only and do not constitute financial advice.
| The Pullback Play (Support/Resistance) | In a strong uptrend, look for the most recent major swing low or breakout candle, place your anchor there. As the stock rallies and eventually pulls back, the anchored vwap indicator will often act as a “moving floor.” |
| The Earnings Anchor | Earnings gaps are the ultimate “change in character.” Anchor your VWAP to the high-volume gap-up candle. If the stock drifts back toward that gap over the next few weeks, the anchored line can act as a potential area of interest for analysis. |
| The “Pinch” Strategy | Use multiple anchors. For example, anchor one line to the Year-to-Date start and another to a recent major low. When these two lines converge (the “pinch”), it creates a zone of confluence. A breakout or bounce from a confluence zone is often considered more informative than a single reference level. |

Anchored VWAP vs. Moving Averages
Traders mostly ask that “Why not just use a 50-day moving average?”. The difference is the volume. A Simple Moving Average (SMA) treats a day with 1 million shares traded the same as a day with 10 million shares. The anchored vwap gives more weight to the 10-million-share day. It reflects where the money is, not just where the time has passed. Let’s see some of the differences between VWAP and Moving Averages.
| Feature | Moving Average | Anchored VWAP |
|---|---|---|
| Purpose | Identifies the general “direction” or smooth path of the price. | Identifies the true “average cost” of all shares traded. |
| Calculation | Price over Time | Price x Volume since Anchor |
| Starting Point | Fixed Period (e.g., 50 days) | Custom (Event-based) |
| Accuracy | Lags during high volume | Dynamic and precise |
| Reset Period | It is continuous and does not reset based on the time of day. | Typically resets daily at the market open (Intraday). |
| Sensitivity | Sensitive only to price spikes, regardless of how many shares were traded. | Very sensitive to large block trades or high-volume bursts. |
| Timeframe Use | Effective on all timeframes, from 1-minute to Yearly charts. | Primarily an Intraday tool (unless using “Anchored VWAP”). |
Common Mistakes to Avoid
To ensure the right use of the tool, it is necessary to keep some tips in mind:
🔸 Don’t Anchor Random Spots: An anchor is only as strong as the event it’s tied to. Use clear “turning points” on the chart.
🔸 Check Different Timeframes: An anchor that looks significant on a 5-minute chart might be invisible on a Daily chart. For swing trading, stick to higher timeframe anchors.
🔸 Volume is Key: If you anchor to a point with very low volume, the resulting line won’t have much “weight” behind it. Look for the “volume spikes.”
Conclusion
The anchored VWAP is not just an indicator; the tool brings context to the noise of the market. Understanding where the “average” trader positioned relative to a major event will help you predict support and resistance levels. Whether you are a day trader by analyzing the latest news or swing trader by analyzing long-term breakout, mastering this tool will help you enhance understanding of price-volume behavior with anchored vwap.
Do You Find This Interesting?
We’d Love to Hear from you-

Frequently Asked Questions
What is the difference between VWAP & Anchored VWAP?
The main difference between VWAP (Volume-Weighted Average Price) and Anchored VWAP lies in their starting points and flexibility:
Standard VWAP: This is primarily an intraday tool that resets every single morning at the market to open. It calculates the average price weighted by volume only for the current trading session, making it ideal for day traders tracking daily sentiment.
Anchored VWAP: This version allows you to choose a specific starting point (the “anchor”), such as a significant earnings gap, a major swing high/low, or a specific news event.
Is anchored VWAP better than VWAP?
“Better” depends on your timeframe.
Standard VWAP is strictly for intraday trading. It resets every morning, which is perfect for seeing the “fair value” of the current day. However, it completely forgot yesterday’s data.
Anchored VWAP is more flexible and often considered superior for swing trading. Since you can “anchor” it to a major event (like an earnings report or a market bottom), it tracks the average price paid by everyone who entered since that specific moment. It doesn’t reset until you tell it to.
Is VWAP a good indicator?
Yes, it is widely considered one of the best indicators because it is used by institutional “smart money.” Large funds use VWAP as a benchmark; if they can buy below the day’s VWAP, they consider it a good fill. Because the biggest players in the market are watching this line, the price often reacts strongly when it touches the VWAP, making it a highly reliable level for support and resistance.
Which timeframe is best for VWAP?
1-Minute to 5-Minute: Best for scalping and quick intraday entries.
15-Minute: The “sweet spot” for most day traders to see the overall daily trend clearly.
Daily/Weekly (for Anchored VWAP): Essential for swing traders who want to see the average cost basis over several weeks or months.
Do professional traders use VWAP?
Yes, VWAP is widely used as a benchmark for professional and institutional traders. In fact, many retail traders call it the “Institutional Benchmark” for several reasons, like execution quality, performance metrics, “Fair Value” logic, etc.
What is the difference between VWAP & Anchored VWAP?
The main difference between VWAP (Volume-Weighted Average Price) and Anchored VWAP lies in their starting points and flexibility:
Standard VWAP: This is primarily an intraday tool that resets every single morning at the market to open. It calculates the average price weighted by volume only for the current trading session, making it ideal for day traders tracking daily sentiment.
Anchored VWAP: This version allows you to choose a specific starting point (the “anchor”), such as a significant earnings gap, a major swing high/low, or a specific news event.
DISCLAIMER: Investment in securities market are subject to market risks, read all the related documents carefully before investing. The securities quoted are exemplary and are not recommendatory. Full disclaimer: https://bit.ly/naviadisclaimer.