Master EMA Crossover: Beginner’s Guide to Successful Trading
Understanding Exponential Moving Average (EMA) Crossover
The world of trading can be complex, filled with jargon and intricate strategies. But fear not, even novice traders can harness powerful tools to make informed decisions. One such tool is the Exponential Moving Average (EMA) crossover. Let’s demystify this concept.
What is an Exponential Moving Average (EMA)?
An Exponential Moving Average (EMA) is a type of moving average that gives more weight to recent prices. Unlike a Simple Moving Average (SMA) which treats all data points equally, the EMA assigns greater importance to the latest data, making it more responsive to price changes. This characteristic makes it a popular choice for traders looking to identify trends quickly.
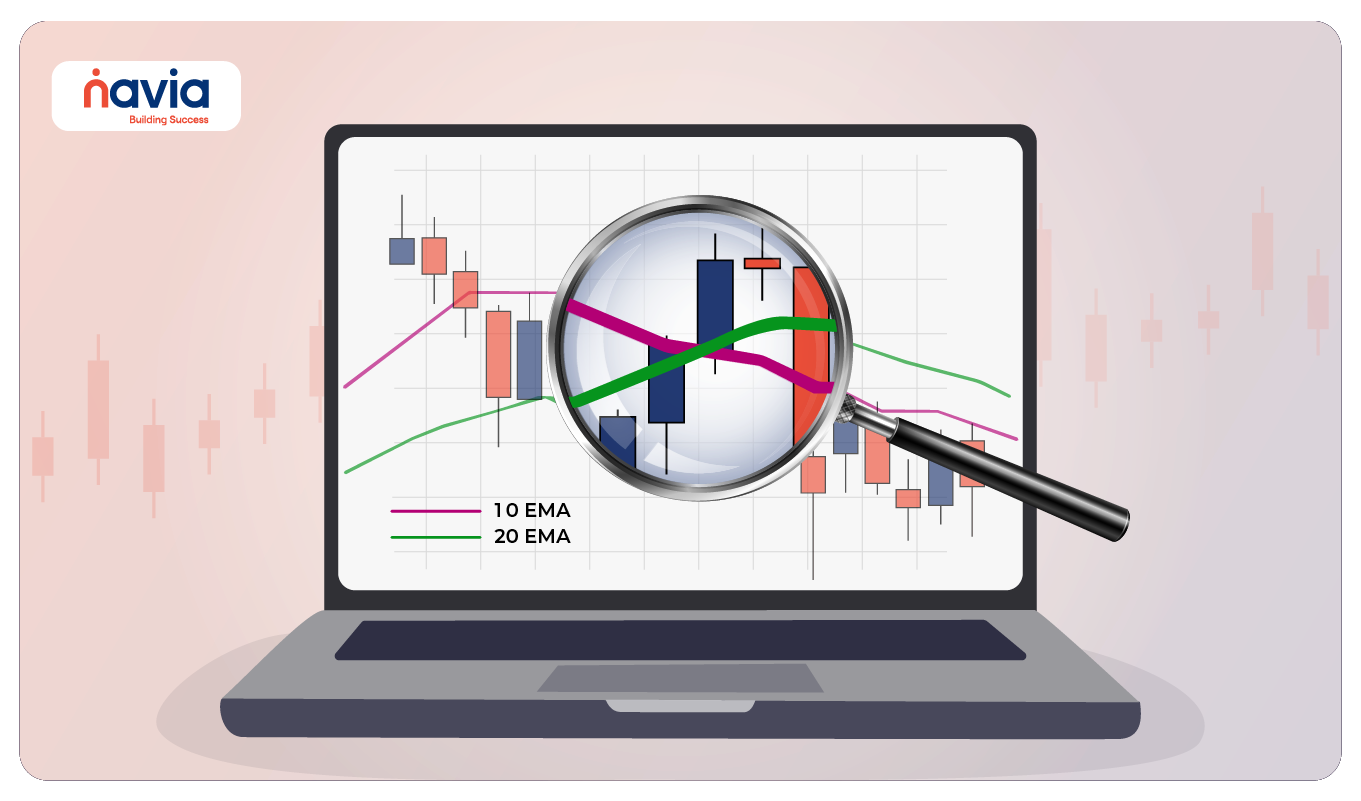
The Significance of 10 EMA and 20 EMA
To harness the power of EMA, traders often compare two different timeframes:
⮞ 10 EMA: This is a short-term EMA, highly reactive to price fluctuations. It’s useful for pinpointing potential entry points in a short-term trend.
⮞ 20 EMA: A medium-term EMA, it provides a broader perspective on the price movement. It’s often used to confirm the overall trend direction and identify potential exit points.
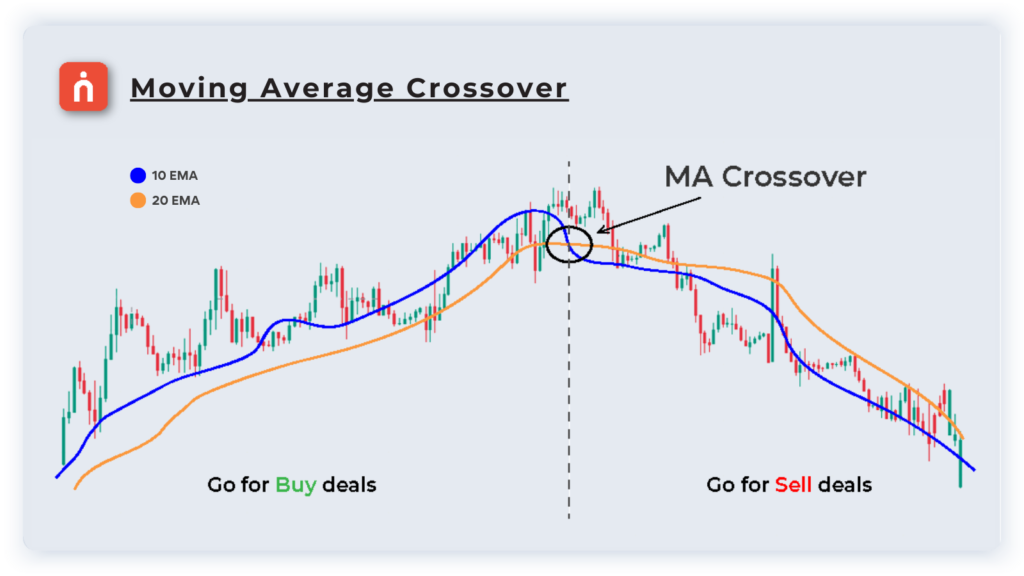
The EMA Crossover: A Trading Signal
The magic happens when these two EMAs intersect on a price chart. This is known as an EMA crossover.
🔸 Bullish Crossover: When the 10 EMA crosses above the 20 EMA, it suggests a potential upward trend. This is often interpreted as a buy signal.
🔸 Bearish Crossover: Conversely, when the 10 EMA dips below the 20 EMA, it indicates a potential downward trend. This is seen as a sell signal.
Why is the EMA Crossover Important?
Traders love the EMA crossover for several reasons:
⮞ Trend Identification: It helps pinpoint potential trend reversals, allowing traders to time their market entries and exits better.
⮞ Trend Confirmation: Comparing two EMAs gives a clearer picture of the trend’s strength and direction.
⮞ Noise Reduction: By smoothing out price fluctuations, EMAs make it easier to spot genuine trends and avoid false signals.
How to Use the EMA Crossover Strategy
1. Set Up Your Chart: Use a trading platform that allows you to overlay EMAs on your price charts. Set one EMA for 10 periods and another for 20 periods.
2. Identify Crossovers: Watch for instances where the 10 EMA intersects with the 20 EMA. These are your potential trading signals.
3. Confirm the Signal: Don’t jump in blindly! Corroborate the crossover signal with other technical indicators or fundamental analysis for added confidence.
4. Execute Your Trade: When you’re confident, enter a buy position on a bullish crossover and a sell position on a bearish crossover.
5. Manage Risk: Always use stop-loss orders to protect your capital. The EMA crossover is a tool, not a guarantee.

A Practical Example:
Imagine you’re tracking a tech stock. The price has been fluctuating. Suddenly, the 10 EMA crosses above the 20 EMA. This bullish signal prompts you to buy the stock. As the price rises, you keep an eye on the EMAs. Later, the 10 EMA dips below the 20 EMA, signaling a potential downturn. You decide to sell, locking in your profits.
Remember: The EMA crossover is a valuable tool, but it’s not foolproof. Combine it with other strategies and always practice risk management for successful trading.
Want to dive deeper into trading? Download the Navia Zero Brokerage Stock Investing app for more tips, strategies, and insights to kickstart your trading journey.
We’d Love to Hear from You