Navia Weekly Roundup (May 11 – 15, 2026)
- Week in the Review
- Indices Analysis
- Interactive Zone!
- Sector Spotlight
- Top Gainers and Losers
- Currency Chronicles
- Commodity Corner
- Top Blogs of the Week!
- N Coins Rewards
Week in the Review
Indian stock markets endured a turbulent week as the benchmark Nifty 50 and the BSE Sensex fell. The week opened with a sharp sell-off on Monday, one of the steepest single-day declines in over a month, before witnessing intraday recoveries that ultimately failed to sustain. Market breadth remained weak throughout, with declines outnumbering advances, and the India VIX surged, reflecting heightened investor anxiety amid geopolitical tensions and macroeconomic concerns.
Indices Analysis
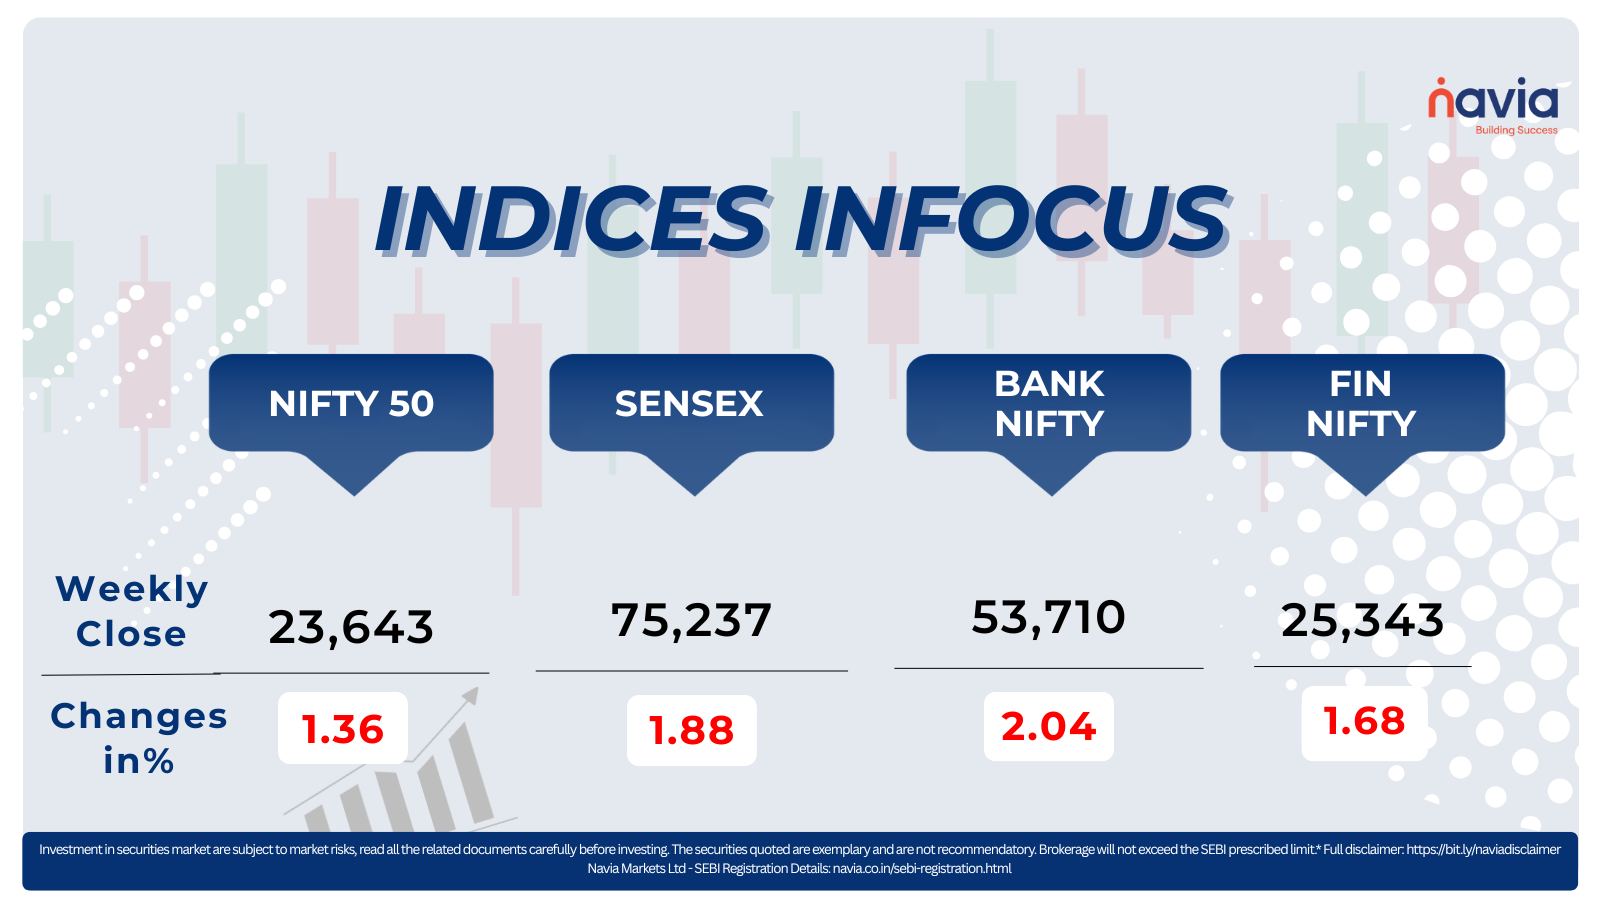
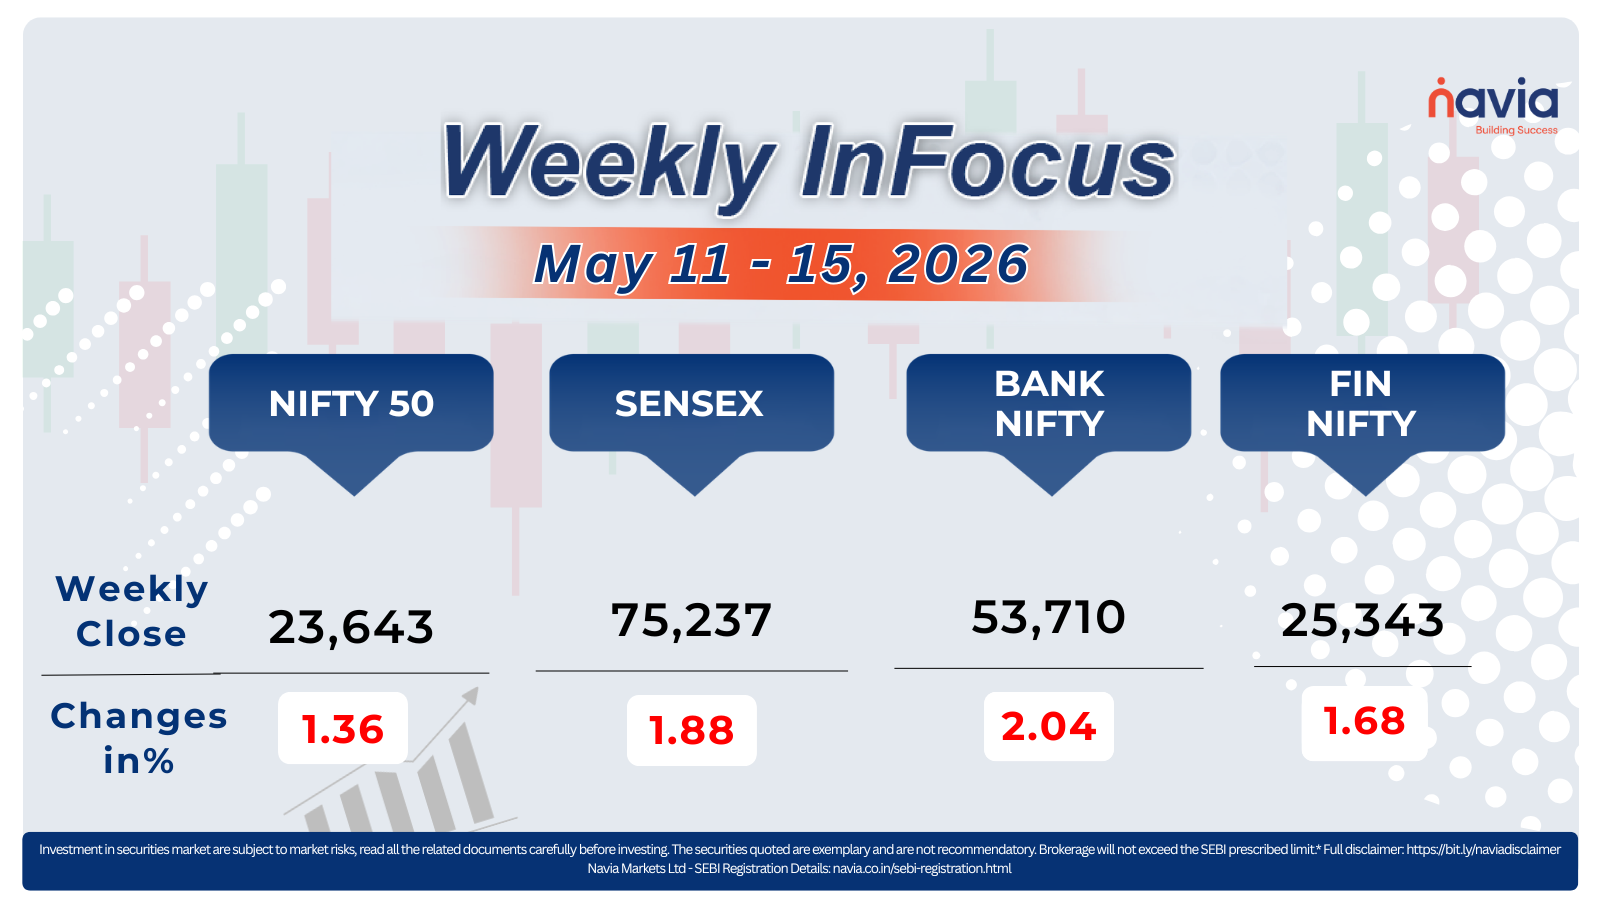
For the week, the BSE Sensex dropped 1.88%, to close at 75,237, while the Nifty 50 loss 1.36%, to settle at 23,643.
The week’s downturn was primarily triggered by the breakdown of US-Iran peace talks, which sparked fears of prolonged conflict in the Persian Gulf and sent Brent crude oil surging. This oil price spike reignited inflation concerns and worsened India’s trade balance outlook, pressuring import-dependent sectors. The India VIX jumped, marking a significant spike in expected volatility. Asian markets turned mixed, and European indices ended flat to lower as global investors grappled with the escalating conflict in the Middle East.
In response to the rupee’s record weakness and rising import costs, Prime Minister made an unprecedented public appeal urging citizens to conserve foreign exchange by postponing non-essential gold purchases and foreign travel. This call triggered sharp selling in jewellery and aviation stocks, with Titan Company plunging and InterGlobe Aviation (IndiGo) dropping on the day.
Interactive Zone!
Test your knowledge with our Markets Quiz! React to the options and see how your answer stacks up against others. Ready to take a guess?
Sector Spotlight
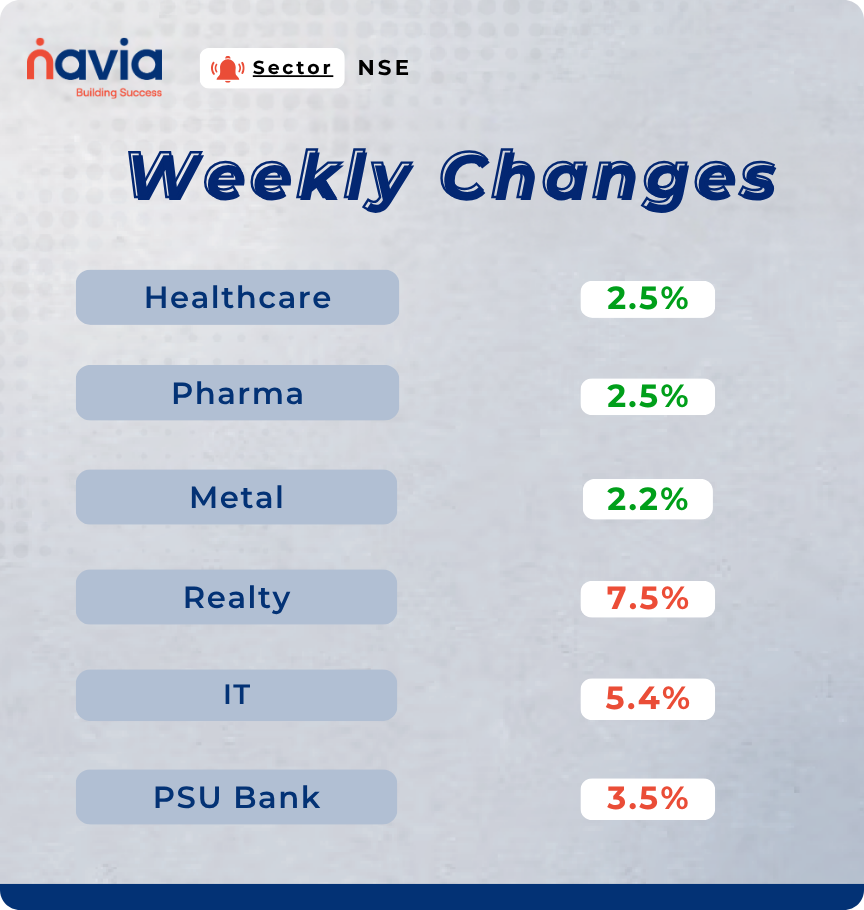
During the week, Indian markets exhibited a mixed sectoral trend. Notable gainers included the Nifty Healthcare index, which rose 2.5%, followed by Nifty Pharma at 2.5% and Nifty Metal at 2.2%. In contrast, the Nifty Realty index emerged as the largest decline, declining 7.5%, while Nifty IT was down 5.4%, and Nifty PSU Bank declined by 3.5%.
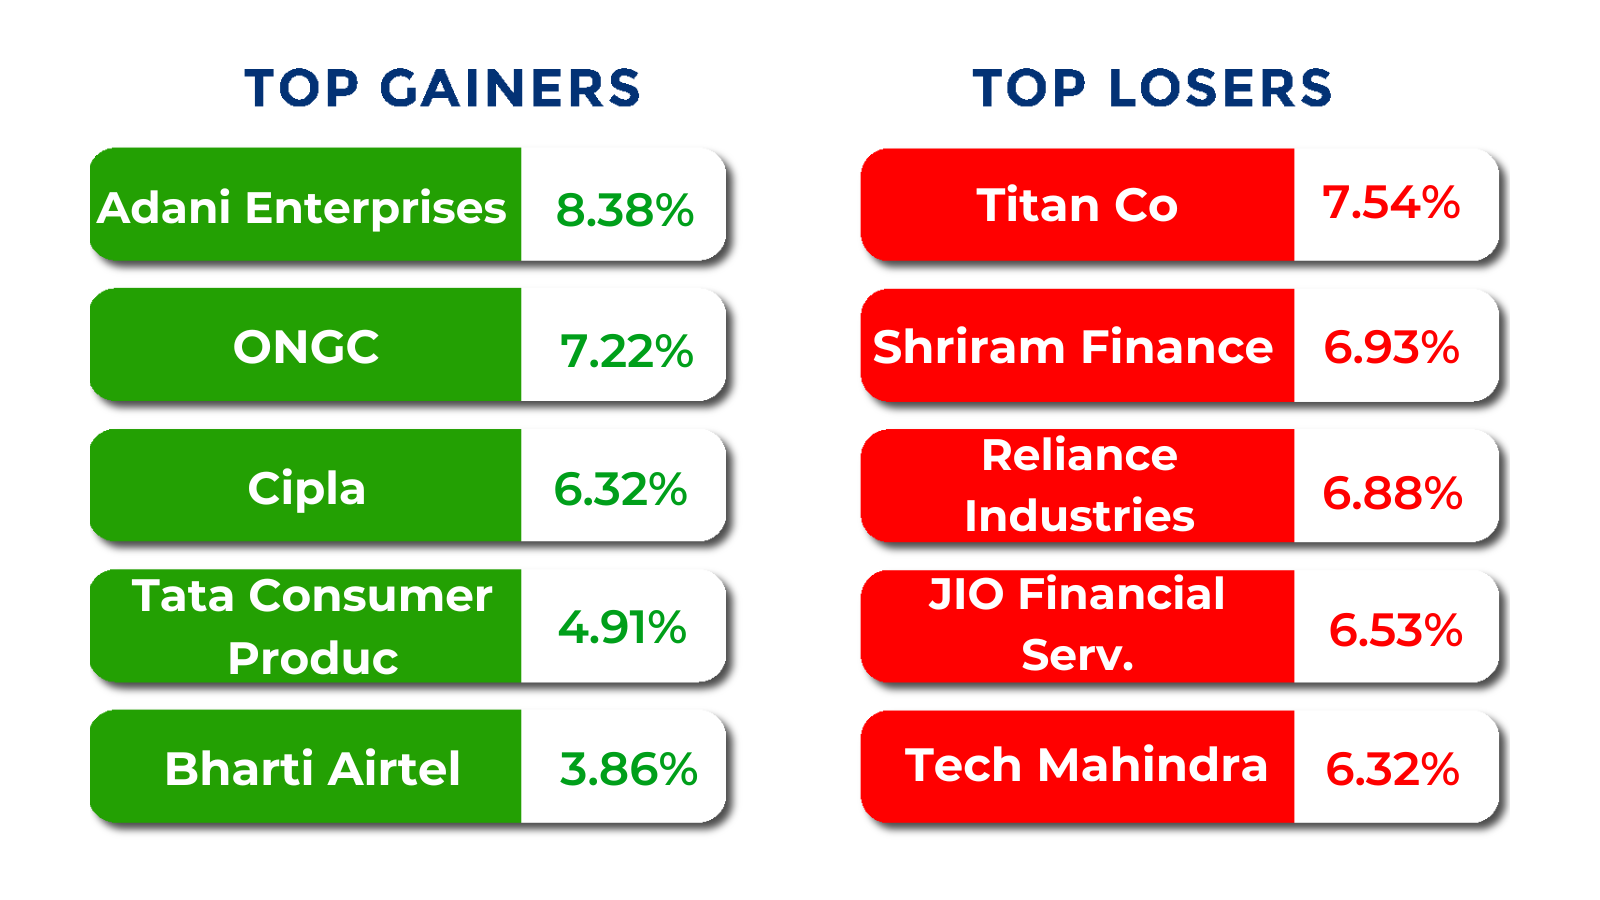
Top Gainers and Losers
Currency Chronicles
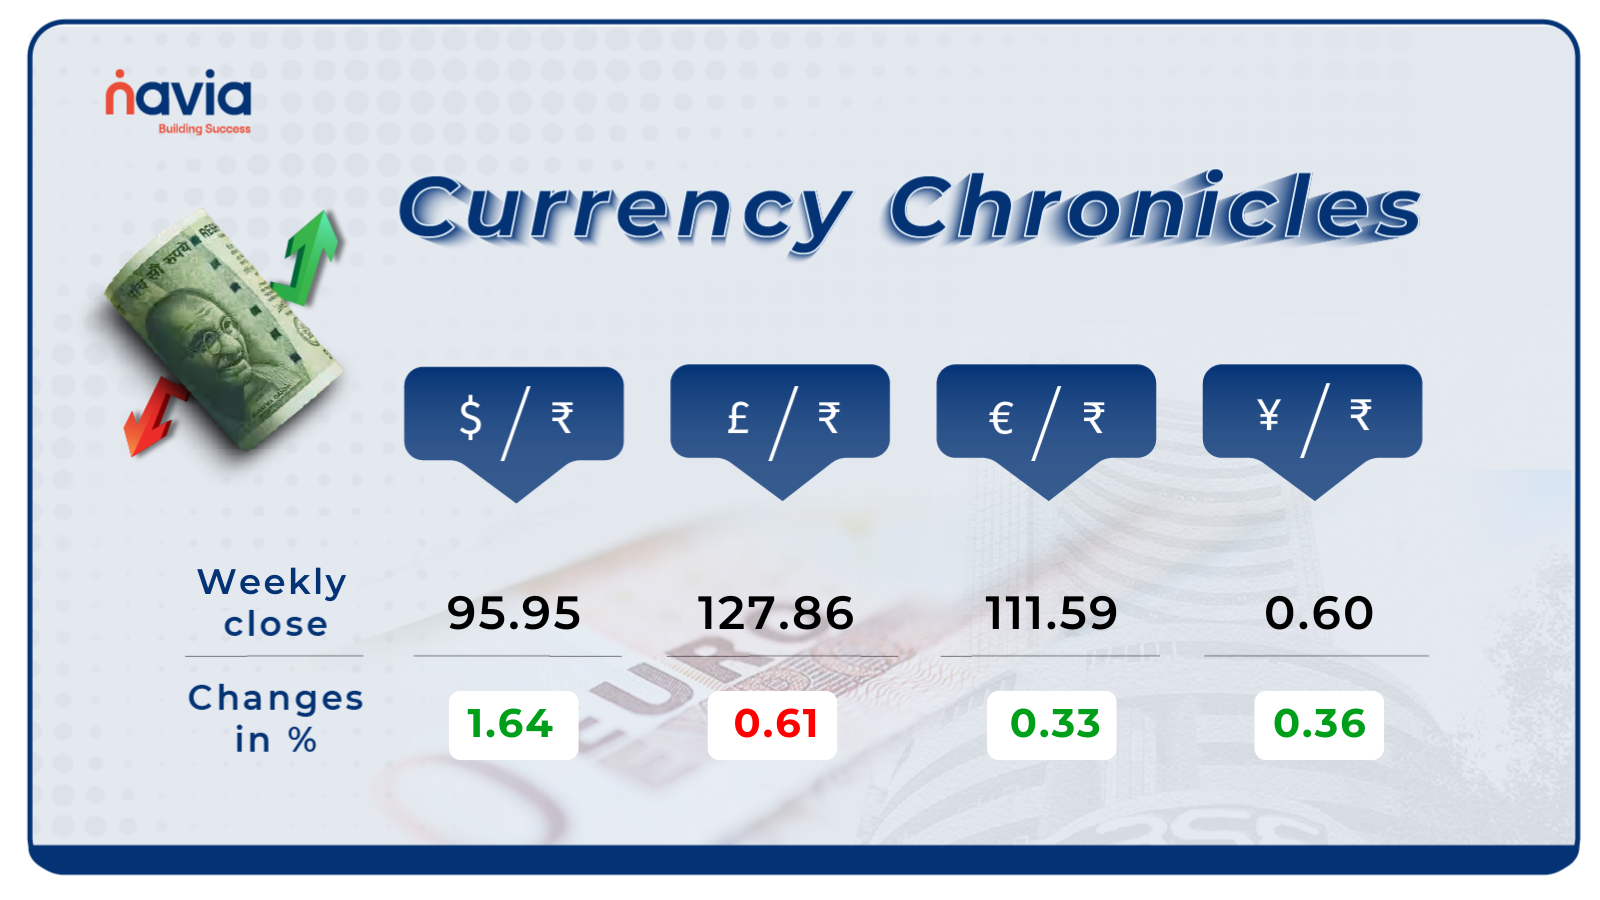
USD/INR:
The USD/INR rate closed at ₹95.95 per dollar, gaining 1.64% during the week, reflecting a bullish market sentiment.
EUR/INR:
The EUR/INR rate closed at ₹111.59 per euro, gaining 0.33% during the week, reflecting a bullish market sentiment.
JPY/INR:
The JPY/INR rate closed at ₹0.60 per yen, gaining 0.36% during the week, reflecting a bullish market sentiment.
Stay tuned for more currency insights next week!
Commodity Corner
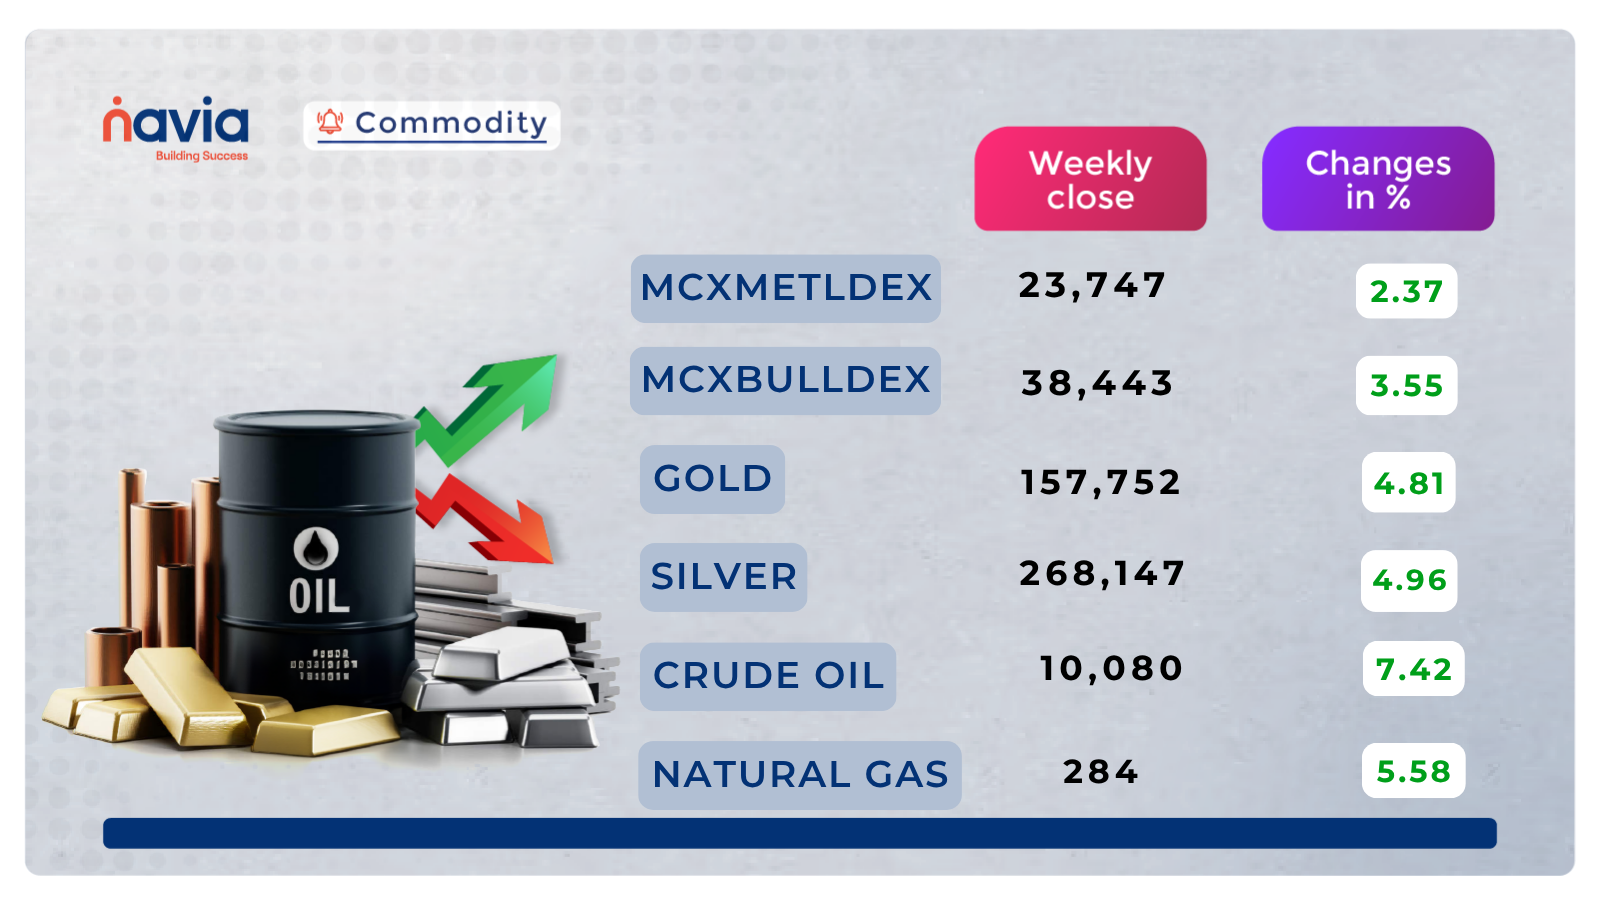
Crude Oil futures are currently showing a mild green candle attempting to stabilise following the prior sessions of corrective pressure from the highs near 10,000. The price continues to hold above the ascending trendline support and sustains within the broader recovery structure, with buyer interest tentatively re-emerging near current levels though conviction remains cautious given the persistent overhead resistance near 9,960.
The broader structure maintains a cautious tone, with the price holding above the key structural support zone but struggling to reclaim meaningful overhead resistance. The current consolidation near 9,700–9,750 reflects a balance between dip buyers defending support and sellers capping each attempted advance. A sustained trade above 9,960 would shift the near-term bias constructively and invite upside momentum toward 10,010 and 10,060. Until then, the market is likely to remain range-bound with a cautious undertone.
On the downside, immediate support lies near 9,515, followed by stronger structural demand near 9,210. A breakdown below 9,515 would delay any recovery and signal a deeper corrective phase, though the broader trendline structure favours a gradual stabilisation as long as price holds above key demand.
Gold futures are currently showing a small red candle drifting below the key structural zone near 162,500 following the sharp and volatile advance that brought price to highs near 164,500 earlier in the week. Despite the prior bullish surge, the price has been unable to sustain above the overhead resistance band near 163,500 and continues to face consistent selling pressure at elevated levels, with the near-term structure reflecting a cautiously bearish tone as sellers assert control near the supply zone.
The broader near-term bias has turned cautiously bearish, with the price retreating from the overhead supply zone and consistent red candle sessions from the highs confirming seller dominance near current resistance. The current zone near 161,500–162,500 represents a critical near-term juncture, with the price at risk of further corrective pressure if buyers fail to defend current levels. A sustained trade below 161,000 would confirm renewed bearish momentum and invite downside pressure toward 159,500 and 158,000.
On the upside, a decisive breakout and sustained close above 163,500 would be required to neutralise the current cautiously bearish tone and invite a renewed bullish attempt, though the prevailing structure firmly favours sellers near resistance unless a clear and sustained close above the overhead supply band materialises.
Natural Gas futures are currently showing a mild green candle holding above the ascending trendline support following the pullback from the recent highs. Despite today’s tentative positive tone, the price remains beneath the key overhead resistance band near 281 and the near-term structure reflects a cautious bias, with buyers defending the trendline on dips but momentum yet to confirm a decisive resumption of the bullish advance.
The broader structure maintains a cautious tone, with the price consolidating between the ascending trendline support and the immediate resistance zone near 281. The current zone near 275–278 reflects a balance of forces, with buyers present near the trendline but sellers continuing to assert at higher levels. A sustained trade above 281 would confirm the resumption of the bullish trend and invite upside momentum toward 283 and 285, though a clear and sustained breakout is needed to validate the next advance.
On the downside, immediate support lies near 273.5, followed by stronger structural demand near 268. A breakdown below 273.5 would invite a corrective retracement toward lower support levels, though the prevailing trendline structure maintains a cautious but positive bias above key demand.
Silver Futures are currently showing a mild red candle extending the pullback from the recent highs near 304,000 following the aggressive rejection from the overhead supply band near 298,500–305,000. Despite the sharp advance earlier in the week, the price is now retreating meaningfully from elevated resistance levels, with sellers asserting consistent control near the supply zone and the near-term structure reflecting a cautiously bearish tone following the rejection from overhead supply.
The broader near-term bias has turned cautiously bearish, with the price failing to sustain above the 298,500 resistance band and the consistent red candle sessions from the highs confirming seller dominance near overhead supply. The current zone near 290,000–292,500 displays limited genuine buyer conviction, with the price at risk of extending the corrective decline toward lower structural support levels. A decisive breakdown below 287,000 would confirm renewed bearish momentum and invite corrective extension toward 285,000 and 283,000.
On the upside, a sustained breakout above 298,500 would be required to neutralise the near-term bearish bias and invite renewed buying interest, though the prevailing structure firmly favours sellers near the current zone unless a decisive and sustained close above the overhead supply band occurs.
Do you have a question? Ask here and we’ll publish the information in the coming weeks.
Top Blogs of the Week!

Exploring Bonds in the Capital Market: Navia Markets x BondVue Partnership
For years, retail investors in India have focused on the high-energy “noise” of the equity markets. But now, a new door has opened. Bonds are now LIVE on the Navia Markets app through a strategic partnership with BondVue, a SEBI-registered Online Bond Platform (OBP).

Investor’s Guide: Using Navia and Jarvis for Portfolio Insights
A successful portfolio isn’t just about the final return figure; it’s about balance, risk management, and diversification. Knowing exactly how your money is spread across sectors and market caps is the difference between “guessing” and “investing.”
N Coins Rewards

Refer your Friends & Family and GET 500 N Coins.
Do You Find This Interesting?

DISCLAIMER: Investment in securities market are subject to market risks, read all the related documents carefully before investing. The securities quoted are exemplary and are not recommendatory. Full disclaimer: https://bit.ly/naviadisclaimer.